Server Colony: who breaks a 3-way deadlock? Go vs Spring vs Workers under load
One contract, three runtimes, six faults. The database broke first.
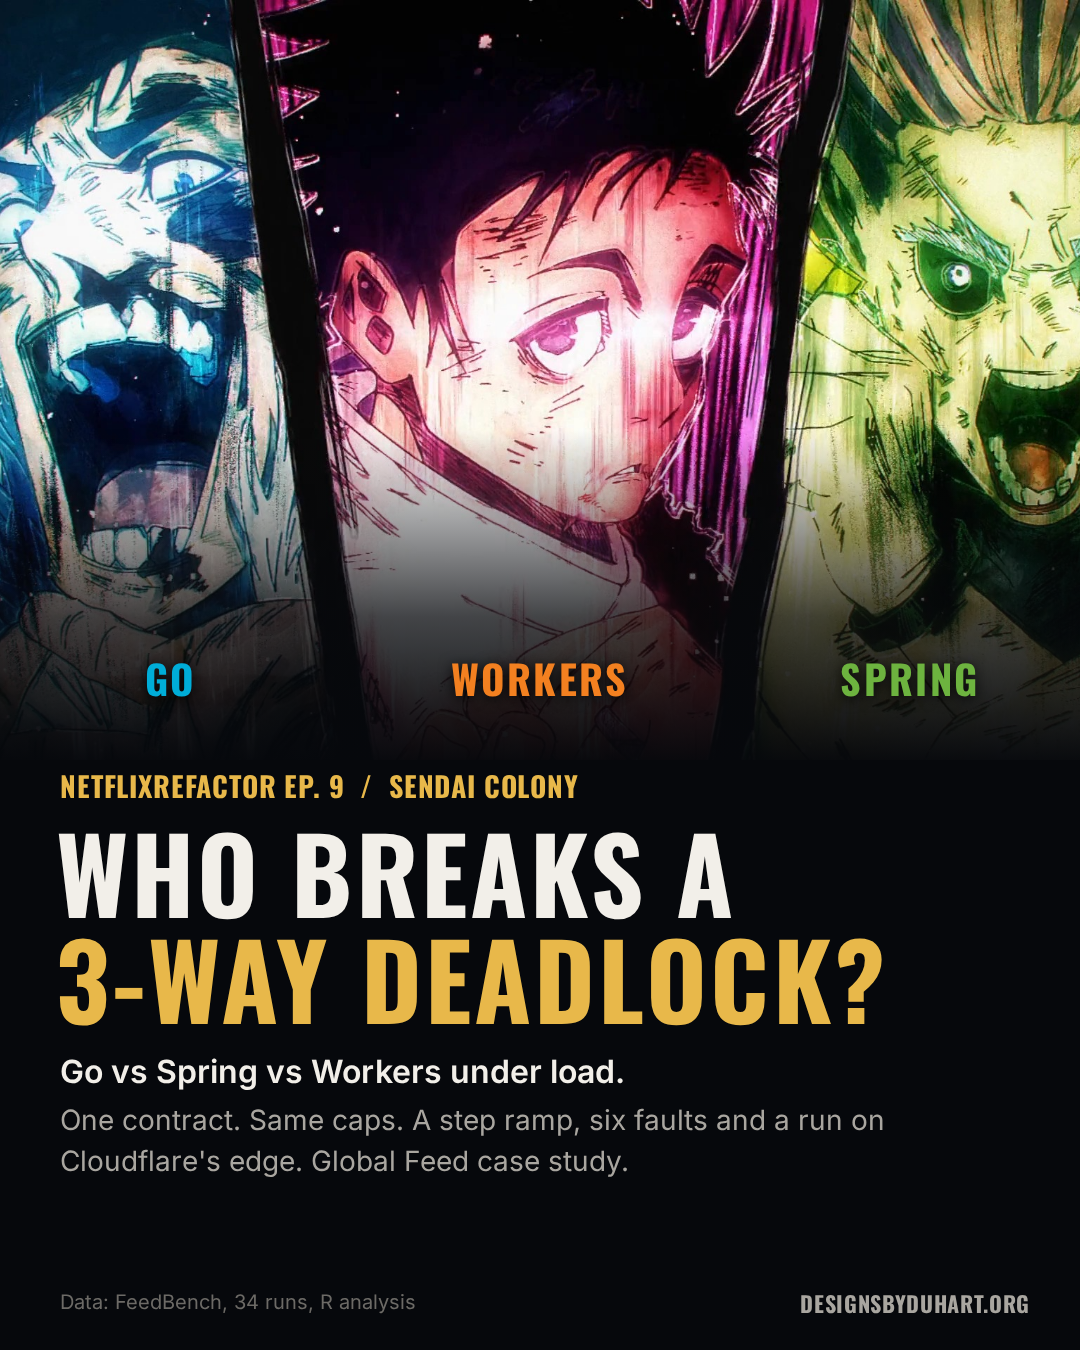
Sendai Colony
If you watched the Culling Game arc, you know Sendai Colony. A handful of heavyweights were stuck in a standoff, each strong enough to hurt the others, none willing to move first, because whoever moved first got jumped. A deadlock. Then Yuta walked in and broke it.
I had my own version of that sitting on my desk. The feed behind my apps runs on one gateway, and the question I kept getting, mostly from myself, was the same one every backend team argues about: what if we'd built it in Go? Or on Spring, the way half the enterprise world would? I went in assuming the gateway was already Go. It isn't. It's TypeScript on Cloudflare Workers. So the standoff became three-way.
So I built all three to one written contract and put them in the same ring. This post is the story and the numbers. The full paper, with every method and every caveat, is here: One Contract, Three Runtimes (PDF).
The ring
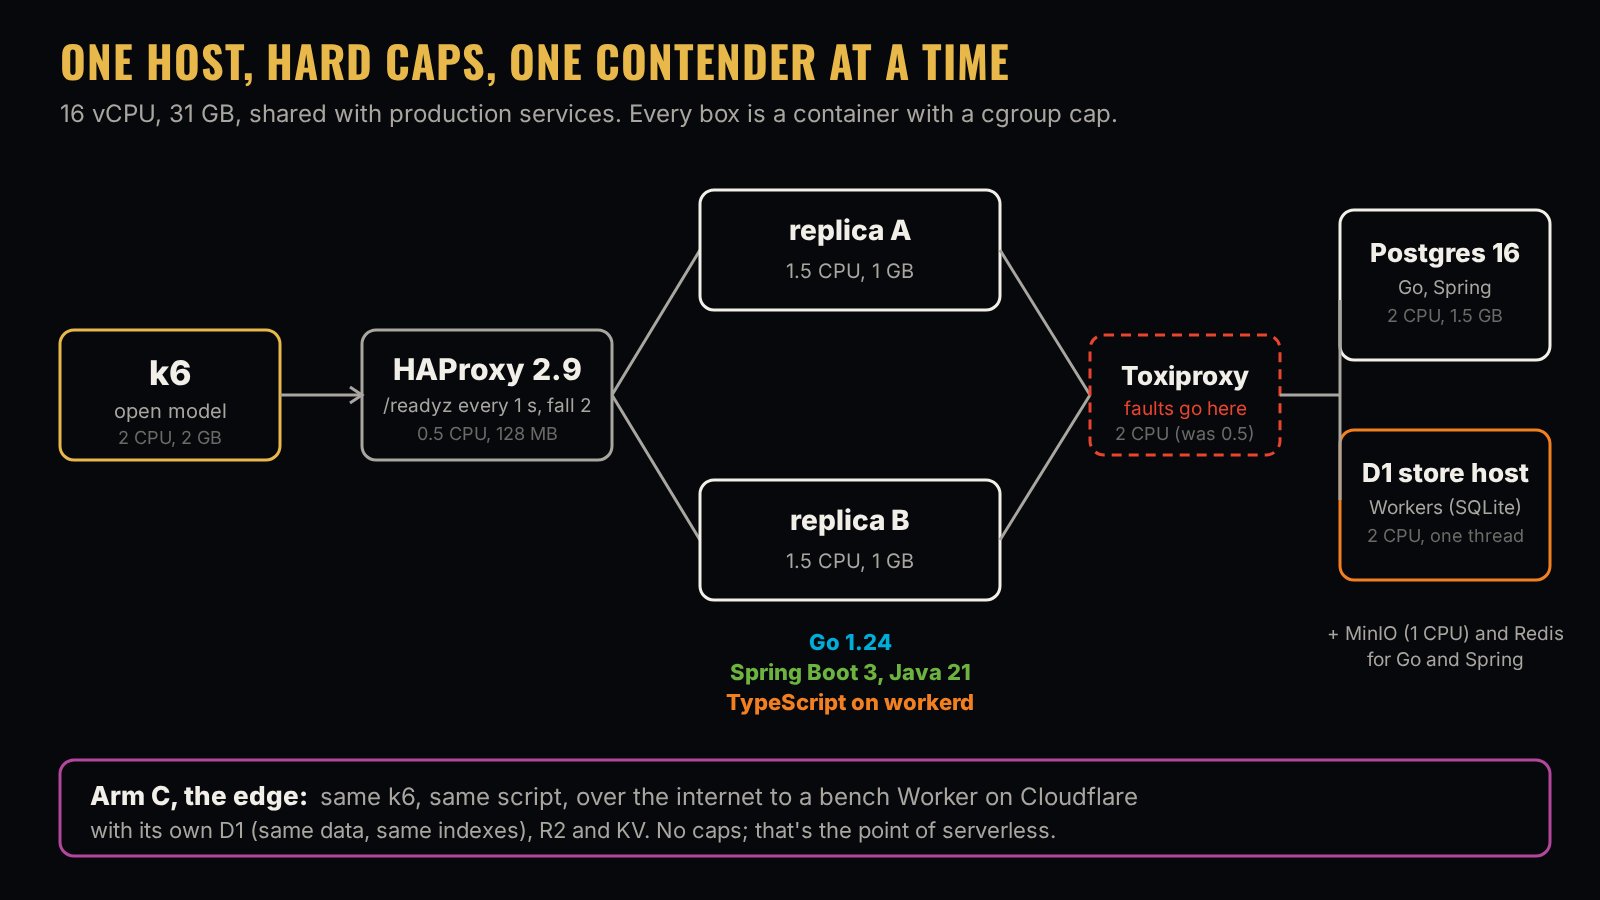
The three contenders and the rules
- Workers: the production TypeScript, unmodified, on workerd (the runtime under Cloudflare Workers) with D1, which is SQLite.
- Go: a port in Go 1.24,
net/httpandpgx, on Postgres 16. - Spring: a port in Java 21 on Spring Boot 3 with virtual threads, built with Maven, also on Postgres 16.
Same contract for all three: nine routes, the same schema, the same error table, the same six-clause visibility check on every read, and the same rule that a feed section slower than 400 ms gets dropped and named instead of failing the page. Each port had to pass the same agreement and mutation tests before it was allowed near the load generator.
The caps: two replicas at 1.5 CPU and 1 GB each behind HAProxy, Postgres at 2 CPU. The objective: p99 under 500 ms and errors under 1%. The load: an open model, meaning arrivals keep coming at the scheduled rate whether the server keeps up or not. A closed loop politely slows down when the server slows down, which hides exactly the latency you're trying to see.
My hypothesis going in was that Workers would win under load because of edge caching. I wrote that down before the first run, along with every method, so I couldn't move the goalposts later.
The open model in k6: a constant arrival rate, not a fixed number of users looping.
function rateScenario(name, rate, durationS, startS) {
  return {
    executor: 'constant-arrival-rate', rate: Math.max(1, Math.round(rate)), timeUnit: '1s',
    duration: `${durationS}s`, startTime: `${startS}s`,
    preAllocatedVUs: Math.min(MAX_VUS, Math.max(10, Math.round(rate * 1.5))), maxVUs: MAX_VUS,
    gracefulStop: '5s', tags: { phase: name }, exec: 'arrival',
  };
}
Steady state
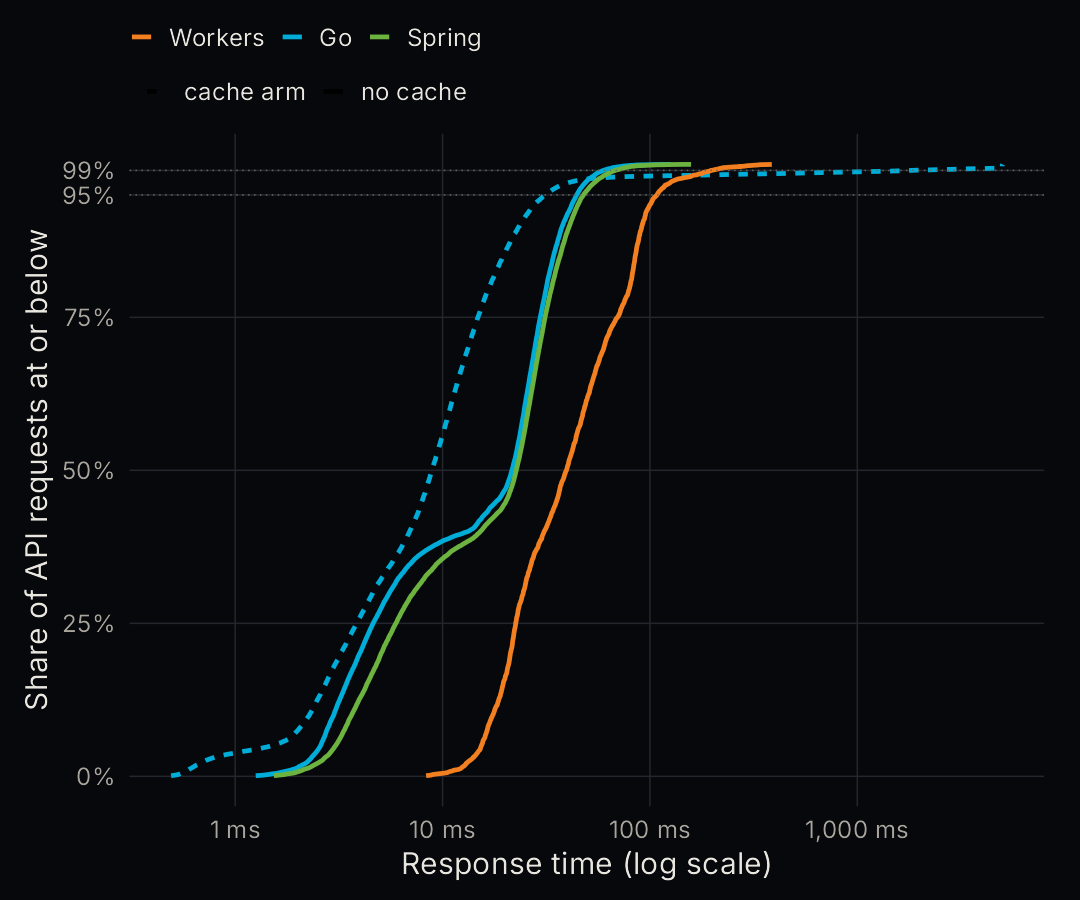
At 70% of each one's own ceiling, Go and Spring look almost identical: p99 of 59 ms and 68 ms, zero errors. Workers, running locally at a sixth of their load, has three times the p99 (197 ms). Go with its in-process cache has the lowest median of anything, 8.9 ms, and the worst tail, which I'll come back to, because that tail is the cache moving the problem somewhere else.
Latency at steady state
The database broke first
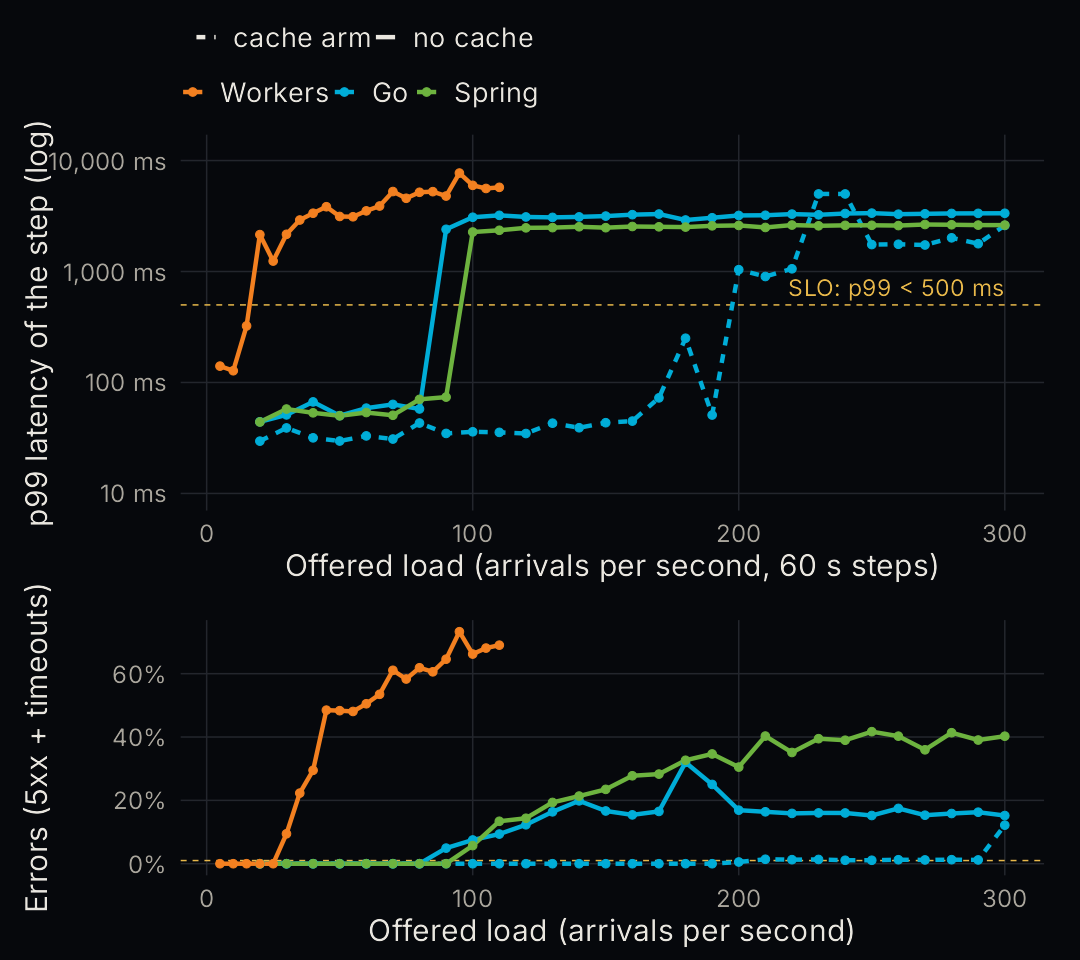
Then I turned the load up, 10 arrivals per second every minute, and watched for the step where the objective broke.
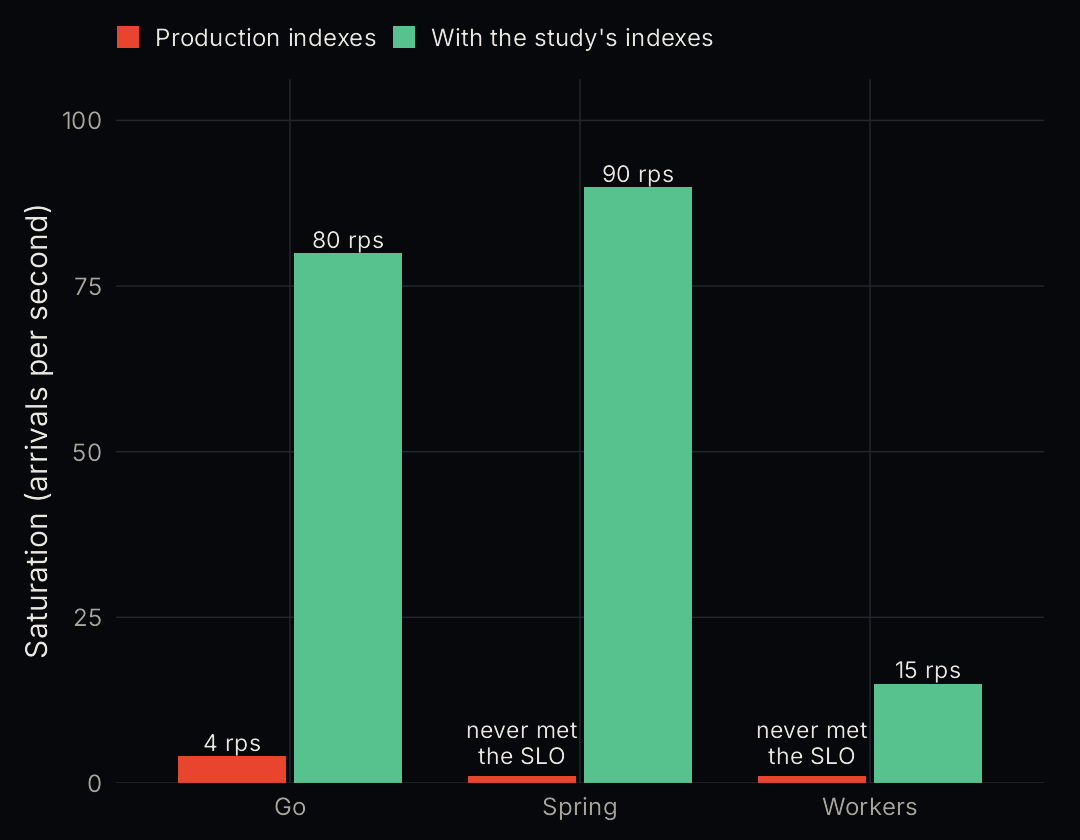
- Go: 80 arrivals per second.
- Spring: 90.
- Workers (local): 15.
- Go with its cache: 190.
Here's the part I didn't expect. At the step where each one broke, Postgres was at 96 to 98% of its CPU cap. The gateways were at 18% (Go) and 37% (Spring) of theirs. For Workers, the D1 store host was pinned at one full core, which is all SQLite's single thread can use, while the Workers replicas sat at 17%. None of the three runtimes was the bottleneck. The data tier was.
I also checked the definition, because "saturation" sounds precise and isn't. Evaluated over each 60 second step, the way an SLO is evaluated, Workers saturates at 15. If you demand that every single second stays under 500 ms, it's 10, because one second inside the 15 step hit 560 ms. Go and Spring don't move under any definition I tried.
Where each one bends
Same ceiling, different bill
If the runtime didn't set the ceiling, where does it show? In what it costs and how fast it gets back up.
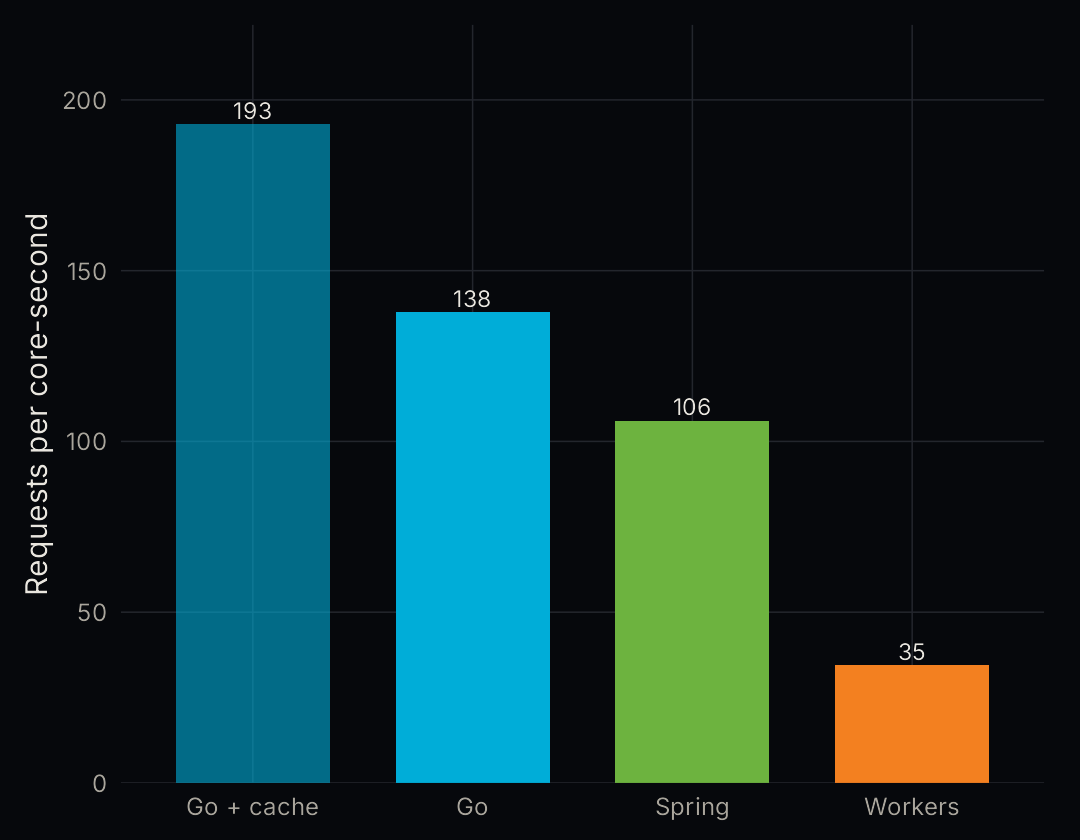
At baseline Go served 138 API requests per gateway core-second. Spring served 106. Workers on local workerd served 35. Memory was the bigger gap: the two Go replicas together held 28 MB, the two Spring replicas 594 MB, the two workerd replicas 1.37 GB. Same feed, same requests.
Requests per gateway core-second
The plot twist: two indexes, 20x
Before any of that, my first smoke runs saturated around 20 arrivals per second for all three. That smelled wrong, so I went digging. The production schema full-scans the feed.
Every feed query filters on archived_at IS NULL AND (ownerBranch OR visitorBranch), and the existing partial indexes require state = 'ready' or visibility = 'public'. The query never implies those, so SQLite couldn't use them and read the whole table, and Postgres took about 1.7 seconds for the suggested section alone. On the production indexes Go held the objective only to 4 arrivals per second. Spring and Workers never met it at all.
I added two indexes. No code change, no query change. Go went from 4 to 80. That's the biggest number in this whole study, and it has nothing to do with which language you pick. I reported it for the production feed too, which has the same shape.
Production indexes vs the study's indexes
Six faults
Every fault ran at 70% of that contender's ceiling: two minutes of normal, the fault, then three minutes to watch it recover. Recovery (RTO) means throughput back within 5% of normal and p95 and p99 back within 10%, held for 10 seconds.
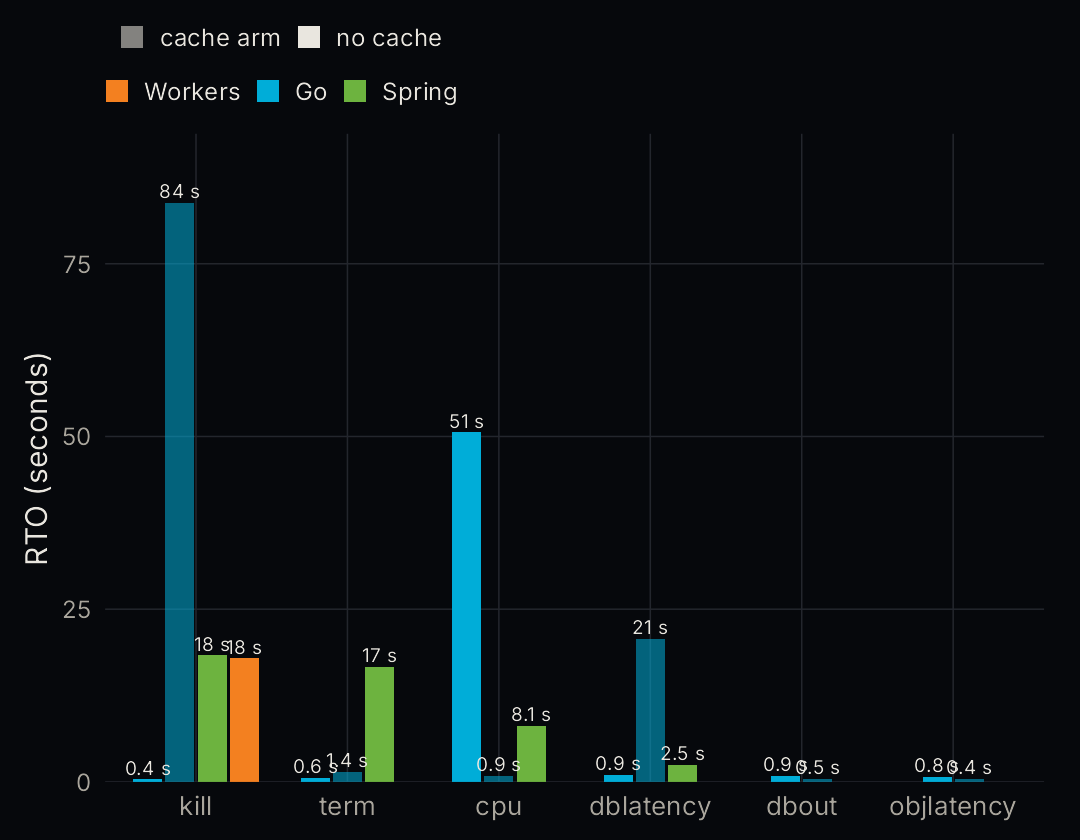
- Kill a replica. Zero errors anywhere, because HAProxy retries and redispatches. But for the 4 seconds before the dead replica got marked down, requests sent to it waited out a 1 second connect timeout, so p99 sat just above 1 s for everyone. Then the runtimes split. Go was back to normal 0.4 s after the restart. Spring took 18 s: the JVM needed 8 s just to answer its first health check, then it ran cold for a while. Workers took 18 s too.
- Graceful shutdown (SIGTERM). Worked exactly as designed: readiness flipped, HAProxy pulled the replica in under 2 s, nobody saw an error. Spring's restart still cost it 17 s.
- Steal the CPU with a noisy neighbor. Nobody's health check noticed, which is what I predicted, and p99 stayed under 81 ms everywhere.
- Add 100 ms to every database call. This one hurt. Go at 56 arrivals per second absorbed it with zero errors and a 1.5 s p99, dropping a feed section 62 times and saying so. Spring at 63 failed 42% of requests. Every statement holds a pooled connection 100 ms longer, and with 32 connections per replica you run out. The loads differ, so I read this as where each configuration broke, not which language is tougher.
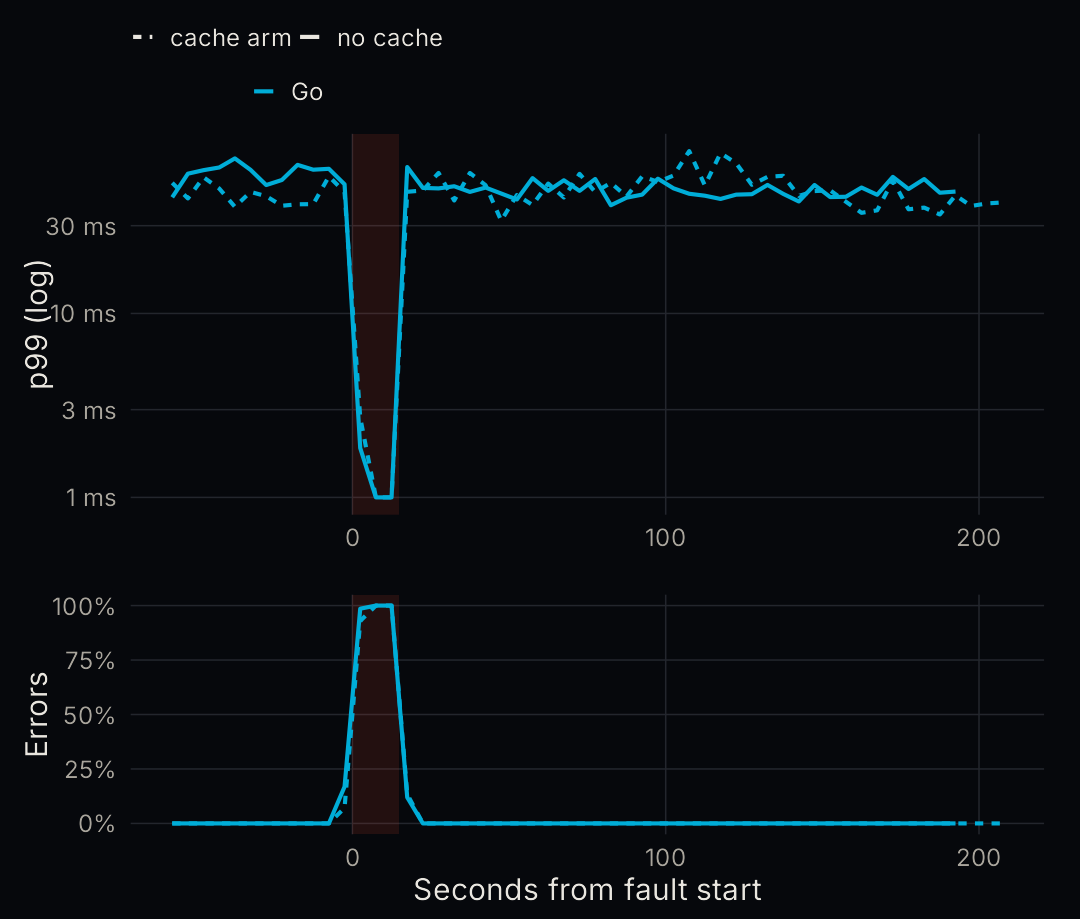
- Cut the database for 15 seconds. Go failed fast, the way the contract says: 503s in about 2 ms instead of hanging threads, then back to normal within a second of the link returning.
- Slow the object store by 150 ms. Only uploads felt it.
And the one that surprised me: Go with its cache took 84 seconds to recover from a kill, against 0.4 s without. The restarted replica comes back with an empty cache and spends a minute refilling it. The extra latency is only tens of milliseconds, but a cache that lives inside a replica dies with it.
Time to recover after the fault is lifted
Kill a Go replica: no cache vs cache
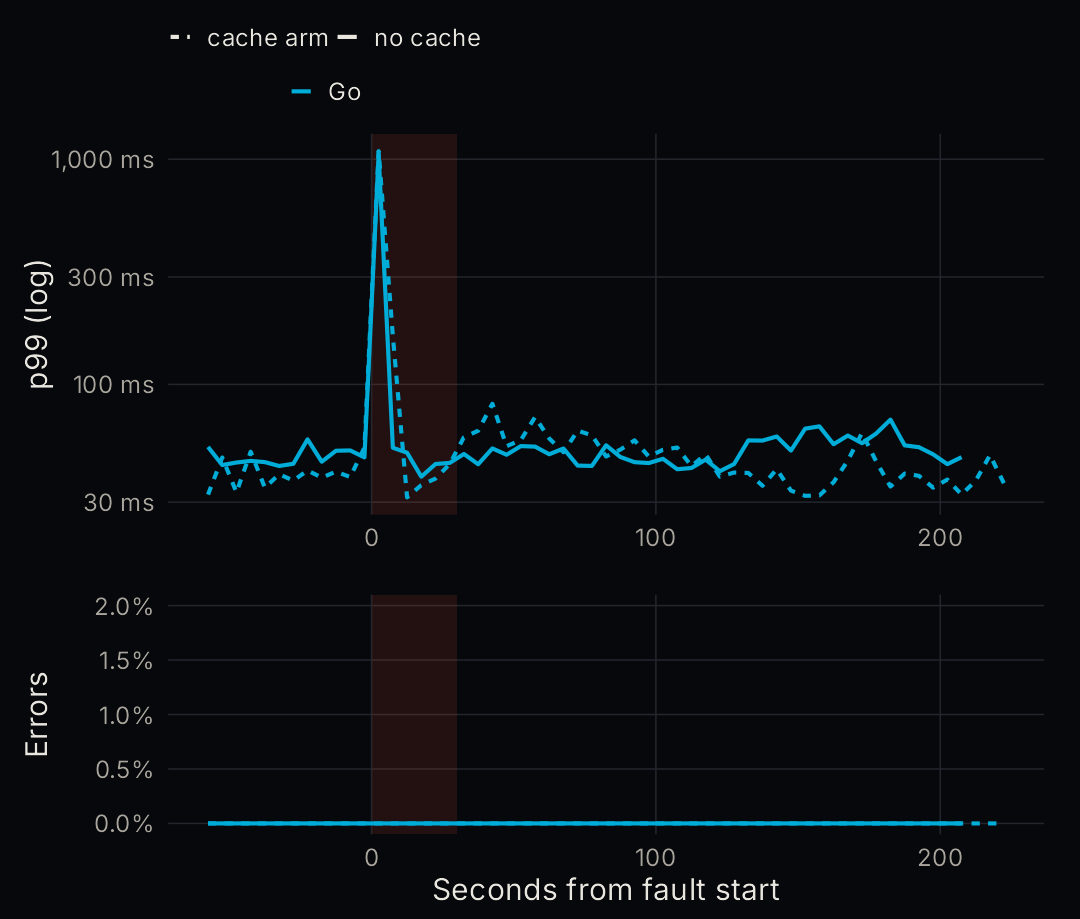
Cut the database for 15 seconds
The edge, and my hypothesis
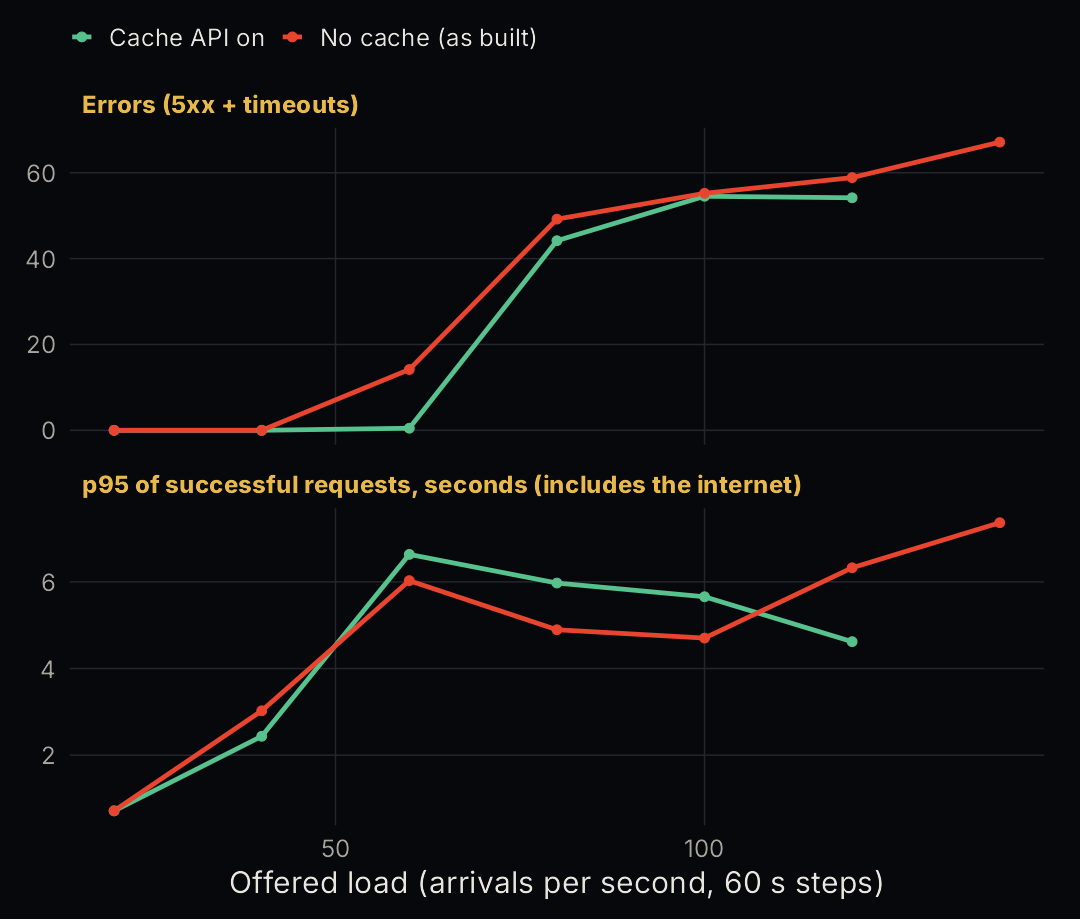
Locally, Workers runs on one box with one SQLite thread. That isn't the real platform, so I deployed a separate bench copy of the Worker on Cloudflare with its own D1, loaded with the same data and the same indexes, and ran the same ramp against it from my server, with the Cache API on and then off.
The cache helped everywhere both arms were healthy. At 35 arrivals per second the median dropped from 1,237 ms to 773 ms, 37% faster, and p99 from 2,351 to 1,644 ms. Errors started at 80 arrivals per second with the cache and at 60 without. The errors were HTTP 500s from the Worker, most likely D1 running out of room, though I couldn't confirm that from Cloudflare's side. And yes, those latencies include the public internet between my server and the edge, so compare the shape of the curves, not the milliseconds.
So, was I right? Partly. Edge caching does make the Workers version better under load. It doesn't make it better than Go or Spring here. By errors alone the edge Worker held 60 arrivals per second, more than local Workers (25), less than Go (80) and Spring (90) on Postgres. The feed is 90% signed-in and personal, the visibility check runs on every request no matter what the cache returns, and D1 is still one database behind it all. Also, the production gateway marks every feed response no-store, so none of these cache gains exist in production today.
Workers on Cloudflare's edge
What broke in the harness
The most useful thing I learned wasn't about any runtime.
My first full set of runs all "saturated near 80 arrivals per second, Postgres-bound". Clean result. Also wrong. The fault proxy that sits between every gateway and its database was capped at 0.5 CPU, and it was pinned at 100% the entire time. When it ran out of memory in the cache runs, the gateways reported DNS errors. I only caught it by reading the proxy's own CPU in the container stats. 22 run directories went in the bin and everything was rerun with the proxy at 2 CPU, where its 95th percentile stayed under 40%.
That wasn't the only one:
- k6 ran out of memory above about 700 virtual users at 2 GB, roughly 2.87 MB each, so I derived a cap from that. It still hits its ceiling far up the ramps, past every saturation point.
- A baseline default ran every baseline at a fixed 100 arrivals per second instead of 70% of the ceiling. Two runs thrown out.
- The disk filled up overnight with upload test data (57 GB), Postgres started failing checkpoints, and 52 run directories from after that point were excluded, including every second and third repetition.
- Somebody else's session pruned every Docker image on the box mid-study. I rebuilt from unchanged source.
- The cache moved the bottleneck to the object store (1 CPU), which hit 100% and started telling the gateways to slow down.
So every number here is a single run, and I'm not calling any small difference significant. The lesson I'm keeping: before you believe a ceiling, check the CPU of everything in the measurement path, including the parts you added to do the measuring.
How the metrics were captured
Everything comes from raw data: k6 logged every request (timestamp, route, status, duration), Docker's cgroup counters were sampled every second for every container, and HAProxy's server status was polled every second. The harness wrote its own summary in Python; I recomputed every number independently in R, and the two agree on every saturation point, RTO and detection time. Here's the R, trimmed for reading. The full version is analysis/R/metrics.R in the FeedBench repo.
Read one run's per-request data and label the phases.
library(data.table)

read_requests <- function(dir, warmup_s, fault_start_s, fault_end_s) {
  r <- fread(cmd = paste("gzip -dc", file.path(dir, "requests.csv.gz")),
             select = c("t_sec", "route", "kind", "status", "duration_ms", "region"))
  r[, phase := fifelse(t_sec < warmup_s, "warmup",
               fifelse(is.na(fault_start_s) | t_sec < fault_start_s, "control",
               fifelse(is.na(fault_end_s) | t_sec < fault_end_s, "fault", "recovery")))]
  r[]
}
Percentiles from every request (never an average of per-second percentiles), plus Apdex and error budget burn.
is_failure <- function(status) status >= 500 | status == 0   # 5xx or no answer at all
q7 <- function(x, p) unname(quantile(x, p, type = 7))

lat_summary <- function(x, T = 100) {
  fail <- is_failure(x$status); ok <- !fail
  list(p50 = q7(x$duration_ms, .50), p95 = q7(x$duration_ms, .95), p99 = q7(x$duration_ms, .99),
       err_rate = mean(fail),
       apdex = (sum(ok & x$duration_ms <= T) + sum(ok & x$duration_ms > T & x$duration_ms <= 4 * T) / 2) / nrow(x),
       budget_burn = mean(fail) / 0.01)   # 1 = burning exactly the 1% budget
}

api <- r[kind == "api"]
api[, lat_summary(.SD), by = phase]
RTO: the first 10 second window after the fault where throughput and tail are back within bounds.
rto_of <- function(api, fault_end, hold = 10) {
  ctl <- api[phase == "control"]
  c_tp <- nrow(ctl) / uniqueN(ctl$t_sec)
  c95 <- q7(ctl$duration_ms, .95); c99 <- q7(ctl$duration_ms, .99)
  per <- split(api$duration_ms, api$t_sec)
  for (w0 in seq(ceiling(fault_end), max(api$t_sec) - hold + 1)) {
    w <- unlist(per[as.character(w0:(w0 + hold - 1))], use.names = FALSE)
    if (abs(length(w) / hold - c_tp) <= 0.05 * c_tp &&
        q7(w, .95) <= 1.10 * c95 && q7(w, .99) <= 1.10 * c99) return(w0 - fault_end)
  }
  NA_real_   # never recovered inside the window: reported, never imputed
}
MTTD: fault start to the first HAProxy sample (1 s resolution) that shows the replica DOWN.
mttd_of <- function(haproxy_csv, fault_start_ms, target = c("gw1", "gw2")) {
  h <- fread(haproxy_csv)[server %in% target][order(ts_ms)]
  down <- h[ts_ms >= fault_start_ms & startsWith(status, "DOWN")]
  if (nrow(down)) (down$ts_ms[1] - fault_start_ms) / 1000 else NA_real_
}
Saturation: the SLO evaluated over each 60 second step, first 5 seconds skipped.
saturation <- function(steps) {   # one row per step: step, p99, err_rate, dropped
  pass <- steps$p99 < 500 & steps$err_rate < 0.01 & steps$dropped == 0
  if (any(pass)) max(steps$step[pass]) else NA_real_
}
So who breaks the deadlock?
Nobody, on throughput. On this hardware the database decides, and two indexes beat any runtime switch. Go wins on cost and on getting back up: a fraction of the memory, the most requests per core, and sub-second recovery. Spring holds its own on throughput, a little ahead of Go here, and pays for the JVM every time a replica restarts. Workers gets real help from the edge cache, but D1 holds it back on a personal, mostly signed-in feed.
What I'd do with this: fix the indexes first, cache at the edge where the response really is shared, give a Spring fleet warm-up traffic before it takes real load, and never trust a benchmark ceiling until you've checked the benchmark.
What's not in here, so you don't have to guess: the cache arm for Spring and Workers, several faults for Spring and Workers, and the second and third repetitions all didn't run before I called it. They're listed in the paper as gaps, not filled in.
- Paper (PDF): One Contract, Three Runtimes
- Code: the FeedBench repo,
contract/(the contract and the index study),go-gateway/,MavenFeedGateway/,workers-gateway/,harness/(k6, chaos, monitor),analysis/R/(every number above).
Next episode: Stream Wars, another round of legit testing.
Next: Stream Wars, another round of legit testing. Same rules, a new fight: the streaming side of the platform under load.
More: LinkedIn · Instagram. Portfolio and case studies: designsbyduhart.org.
If any of this saved you an afternoon, Buy me a coffee.