The Big Short: bubble or base camp? The AI boom, mapped
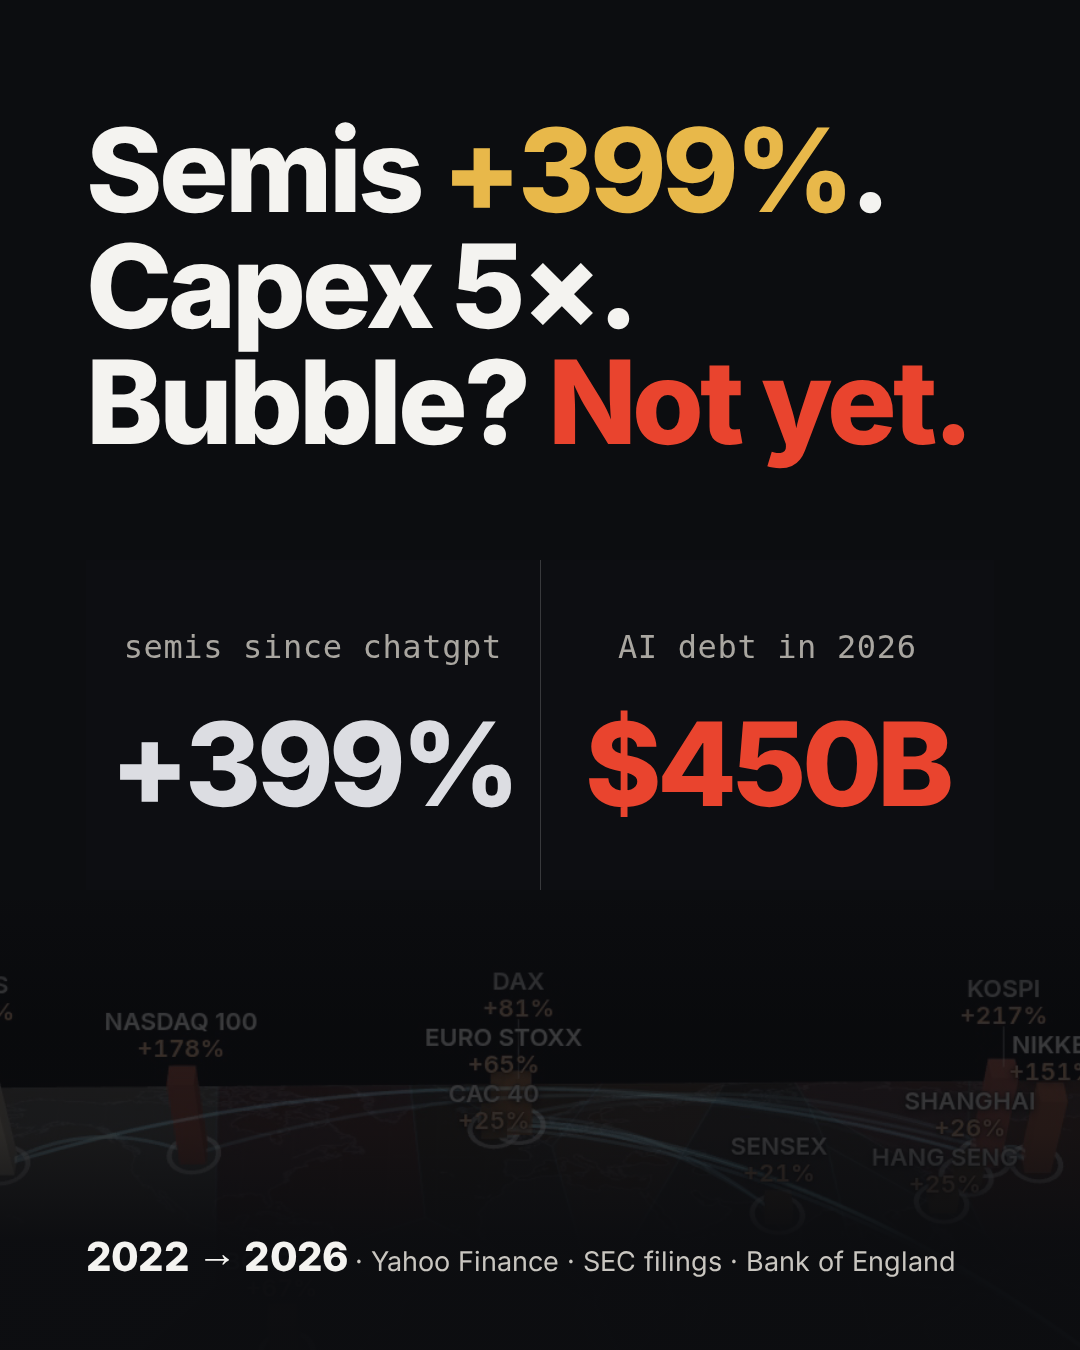
Semis +399%. Capex 5×. Bubble? Not yet.
The question
In episode 1 I pulled 55 years of prices and found that a 1971 dollar kept 12 cents of its value. Money that sits still shrinks, so it goes looking for somewhere to grow, and for three years a lot of it has gone into one trade. That is episode 2's question. Is AI a bubble?
Everybody has an opinion on that, and most of them come with a ticker symbol attached. I wanted something plainer. Pick a start date, put the markets on one map, and look at where the money actually went. Then put that next to what the companies are spending, what they are earning from AI, and what the last bubble looked like at its peak.
The start date is December 2022, the first month-end after ChatGPT launched on November 30, 2022. Every number in the map is a gain from that close. Remember where you started, because that is the whole trick of reading a run like this one.
The AI bubble, mapped
What the map shows
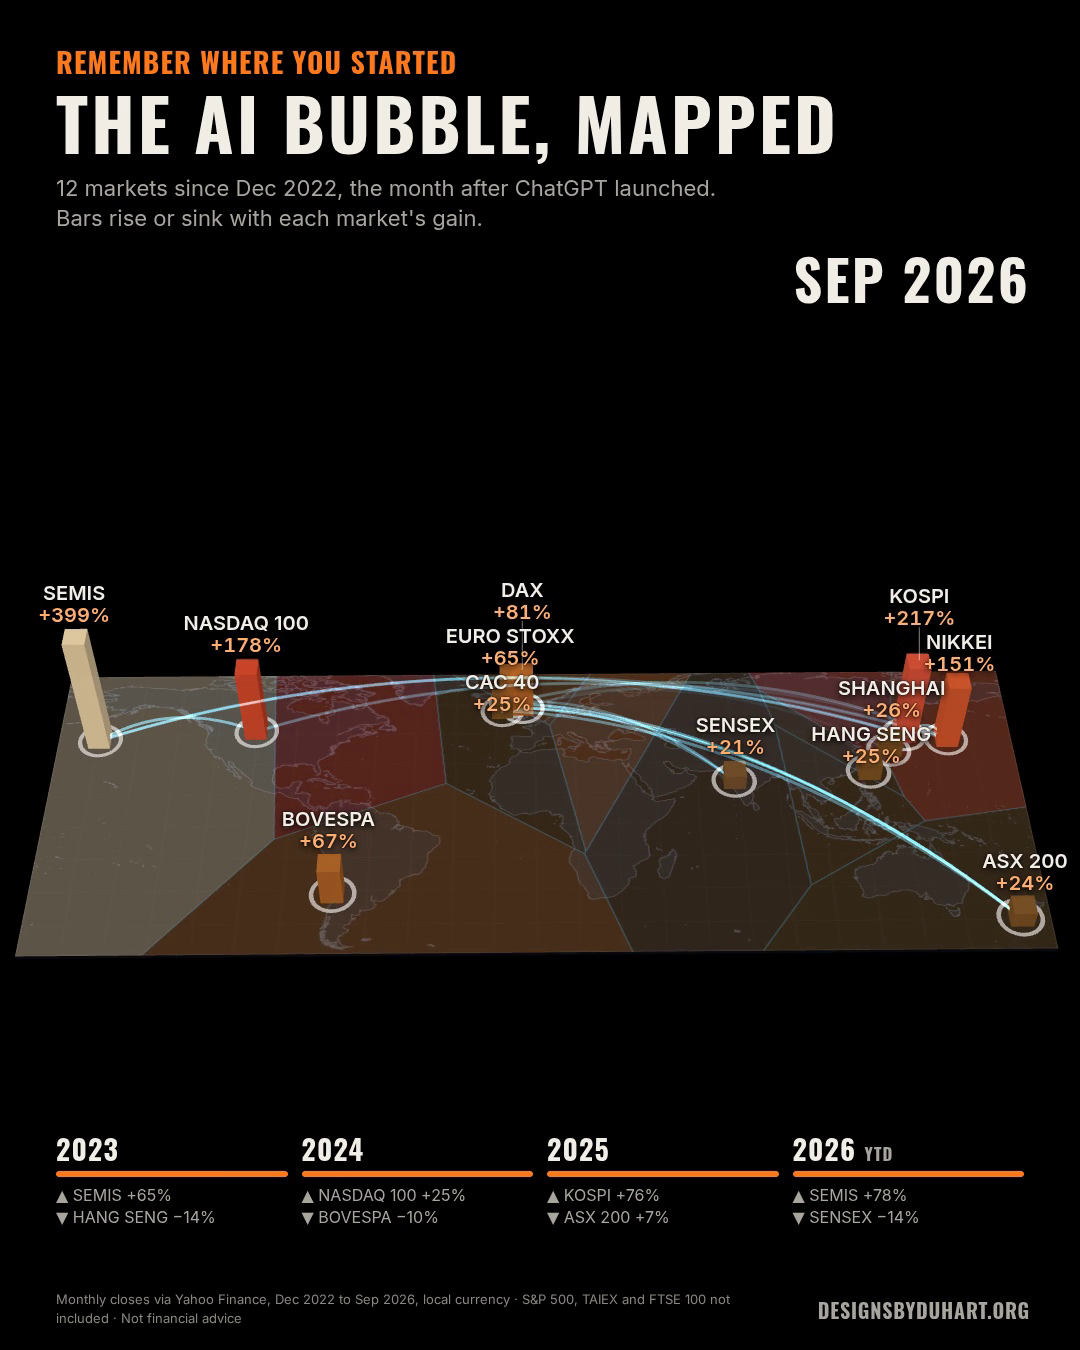
I mapped twelve markets: the US semiconductor index, the Nasdaq 100, Korea's KOSPI, Japan's Nikkei 225, Germany's DAX, the Euro Stoxx 50, France's CAC 40, Shanghai, Hang Seng, Brazil's Bovespa, India's Sensex and Australia's ASX 200. Monthly closes from Yahoo Finance, December 2022 through September 2026, each in its own currency. The S&P 500, Taiwan's TAIEX and the FTSE 100 are not in this cut.
Here is where they stand in September 2026, measured from December 2022:
- Semiconductors: +399%. About five times where they started.
- KOSPI: +217%. Korea's index leans heavily on Samsung and SK Hynix, the two big makers of the memory chips AI servers run on.
- Nasdaq 100: +178%.
- Nikkei 225: +151%.
- DAX +81%, Bovespa +67%, Euro Stoxx 50 +65%.
- Shanghai +26%, CAC 40 +25%, Hang Seng +25%, ASX 200 +24%, Sensex +21%.
So the ranking is basically a chip supply chain. The places that make or sell the hardware are at the top. The markets with little AI exposure did what markets do in an ordinary few years.
Year by year
The leader and the laggard each year tell the story in four lines:
- 2023: semis +65%, Hang Seng -14%.
- 2024: Nasdaq 100 +25%, Bovespa -10%.
- 2025: KOSPI +76%. Nobody lost money; the weakest of the twelve, the ASX 200, still made 7%.
- 2026 through September: semis +78%, Sensex -14%.
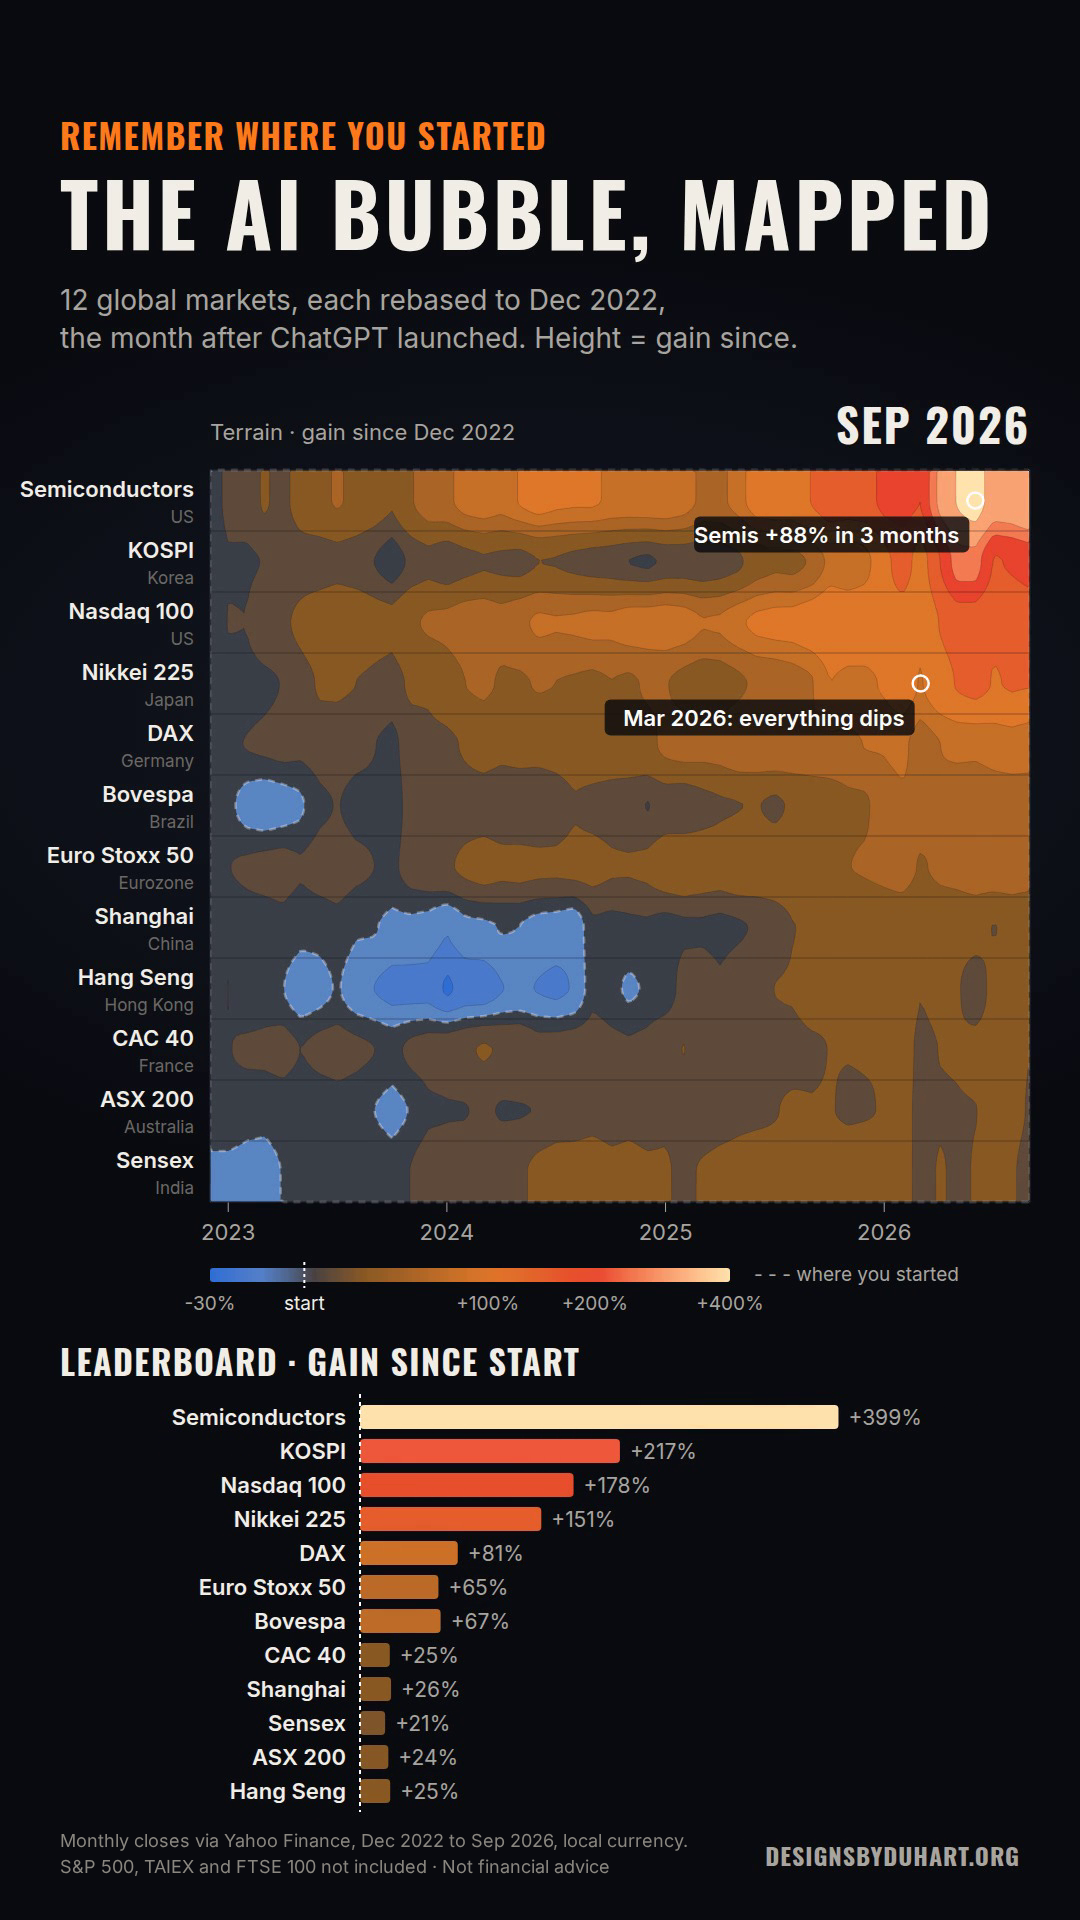
Two moments in the terrain view are worth slowing down for. Early in 2025, DeepSeek and the tariff shock knocked semis down 16%. In March 2026 everything dipped at once. Then semis ran 88% in three months, peaked in June, and gave back a chunk in July: by NBC's count the Philadelphia semiconductor index fell 25% from its June 22 high into late July, a bear market inside a boom, and chip stocks lost more than $1 trillion of value (NBC News). By September the semis on my map were back to +399%.
A market that can lose a sixth of its value on one Chinese model release and then nearly double in a quarter is not behaving like a utility. That is the volatility you get when the price depends on a story about the future more than on this year's earnings.
The same run as terrain
What they are spending
The chip stocks are only the scoreboard. The money behind them is capital spending, mostly data centers, and the four biggest spenders file it with the SEC every quarter.
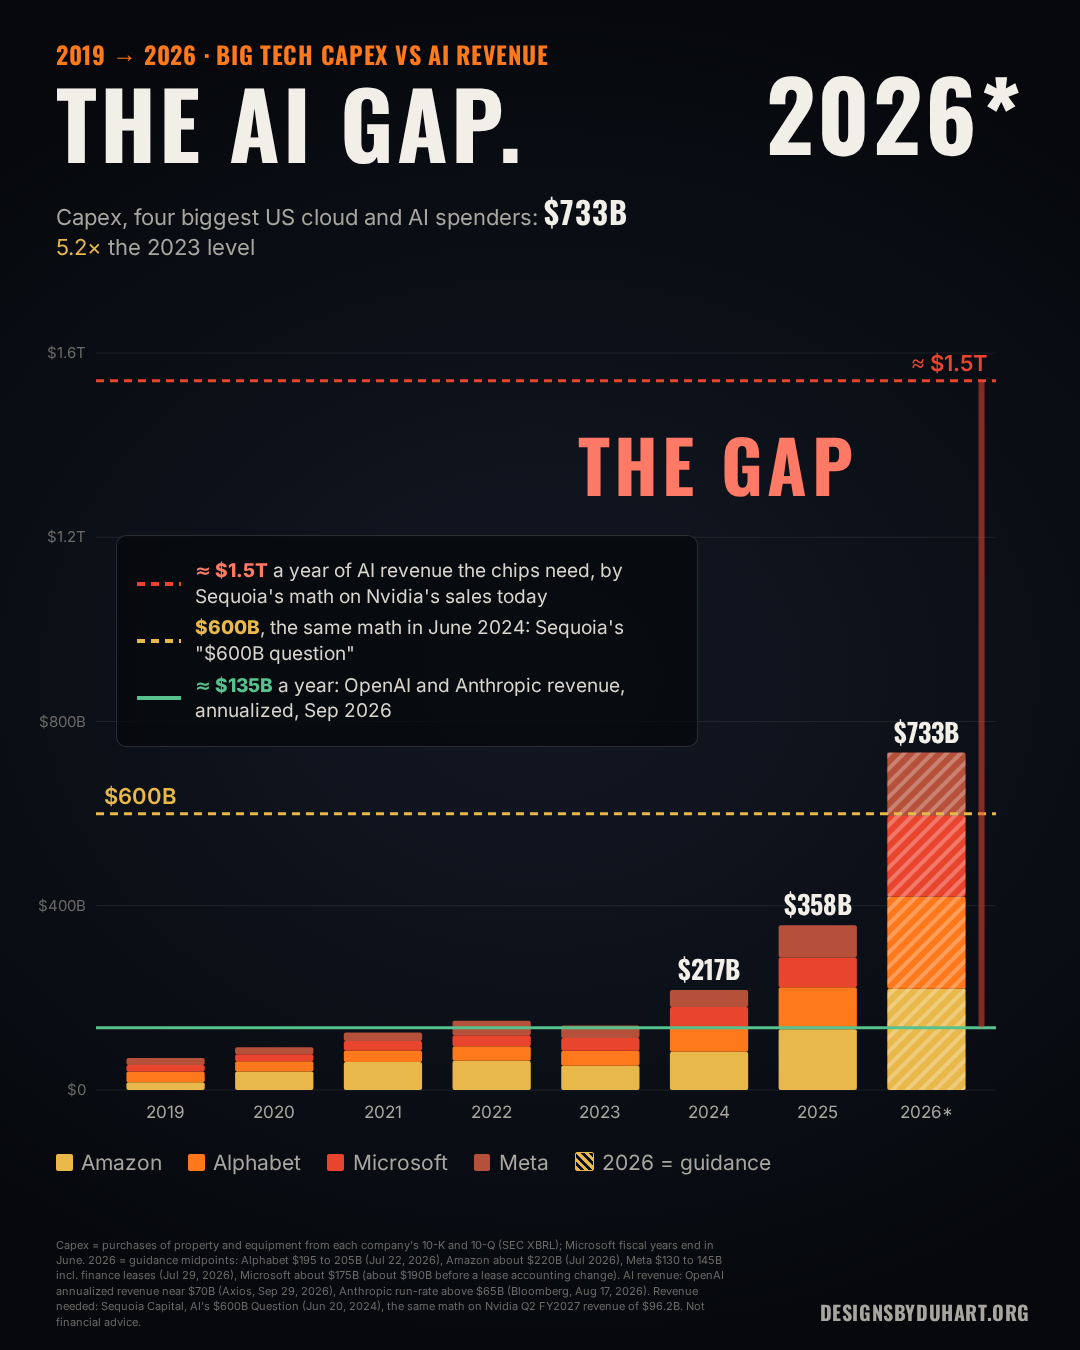
Amazon, Alphabet, Microsoft and Meta spent $69 billion on property and equipment in 2019. In 2023, the ChatGPT year, it was $140 billion. In 2024, $217 billion. In 2025, $358 billion (10-K filings, with Microsoft on its fiscal year that ends in June).
Then look at what they have told investors about 2026. Alphabet raised its range to $195 to 205 billion (Q2 2026 release). Meta narrowed to $130 to 145 billion (Q2 2026 release). Amazon raised to about $220 billion and blamed part of it on memory prices (The Motley Fool, Aug 24, 2026). Microsoft is around $175 billion for calendar 2026 after a lease accounting change, about $190 billion on the old basis (CFO Dive, Jul 30, 2026).
Add the midpoints and it comes to roughly $733 billion in one year. That is about 5.2 times the 2023 level. The semis are about five times where they started, and so is the spending that pays them. That is not a coincidence. One company's capex is the other company's revenue.
Oracle is the fifth name, and the most stretched. It spent $55.7 billion in its fiscal year that ended in May, against $32.0 billion of operating cash flow, and reported negative free cash flow of $5.4 billion for the quarter that ended in August (Oracle 8-K, Sep 10, 2026).
The AI gap
What it earns
This is where every AI bubble argument actually lives. Spending is easy to count. AI revenue is harder, because most of it is buried inside cloud bills and software subscriptions.
The cleanest numbers come from the two biggest model companies:
- OpenAI: annualized revenue close to $70 billion as of late September, up about 70% since July (Axios via PYMNTS, Sep 29, 2026).
- Anthropic: a run-rate above $65 billion by the end of July (Bloomberg, Aug 17, 2026). Its draft IPO filing, as reported by Fortune, shows $4.6 billion of revenue for all of 2025 and a $42 billion net loss, most of it a non-cash charge (Fortune, Sep 29, 2026).
Together that is about $135 billion a year, and it is growing faster than anything I have seen in a revenue line. Microsoft said its AI business passed a $37 billion run-rate in April (Microsoft, Apr 29, 2026), and Amazon says its AI business is past $25 billion. I do not add those to the $135 billion, because a lot of OpenAI's and Anthropic's spending is that cloud revenue. Counting both would count the same dollar twice.
Now the yardstick. In June 2024 David Cahn at Sequoia Capital asked AI's $600B question. His math was simple: take Nvidia's revenue run-rate, double it for everything else a data center costs (power, buildings, networking), and double it again so the people selling AI to end users earn a 50% margin. That came to $600 billion of AI revenue the industry needed every year.
Run the same math on today's Nvidia. It reported $96.2 billion of revenue for the quarter that ended in July (Nvidia, Aug 26, 2026). Four quarters of that is about $385 billion, and doubled twice it is about $1.5 trillion. The revenue grew faster than anyone expected. The bill grew faster than that.
Is this 2000 again?
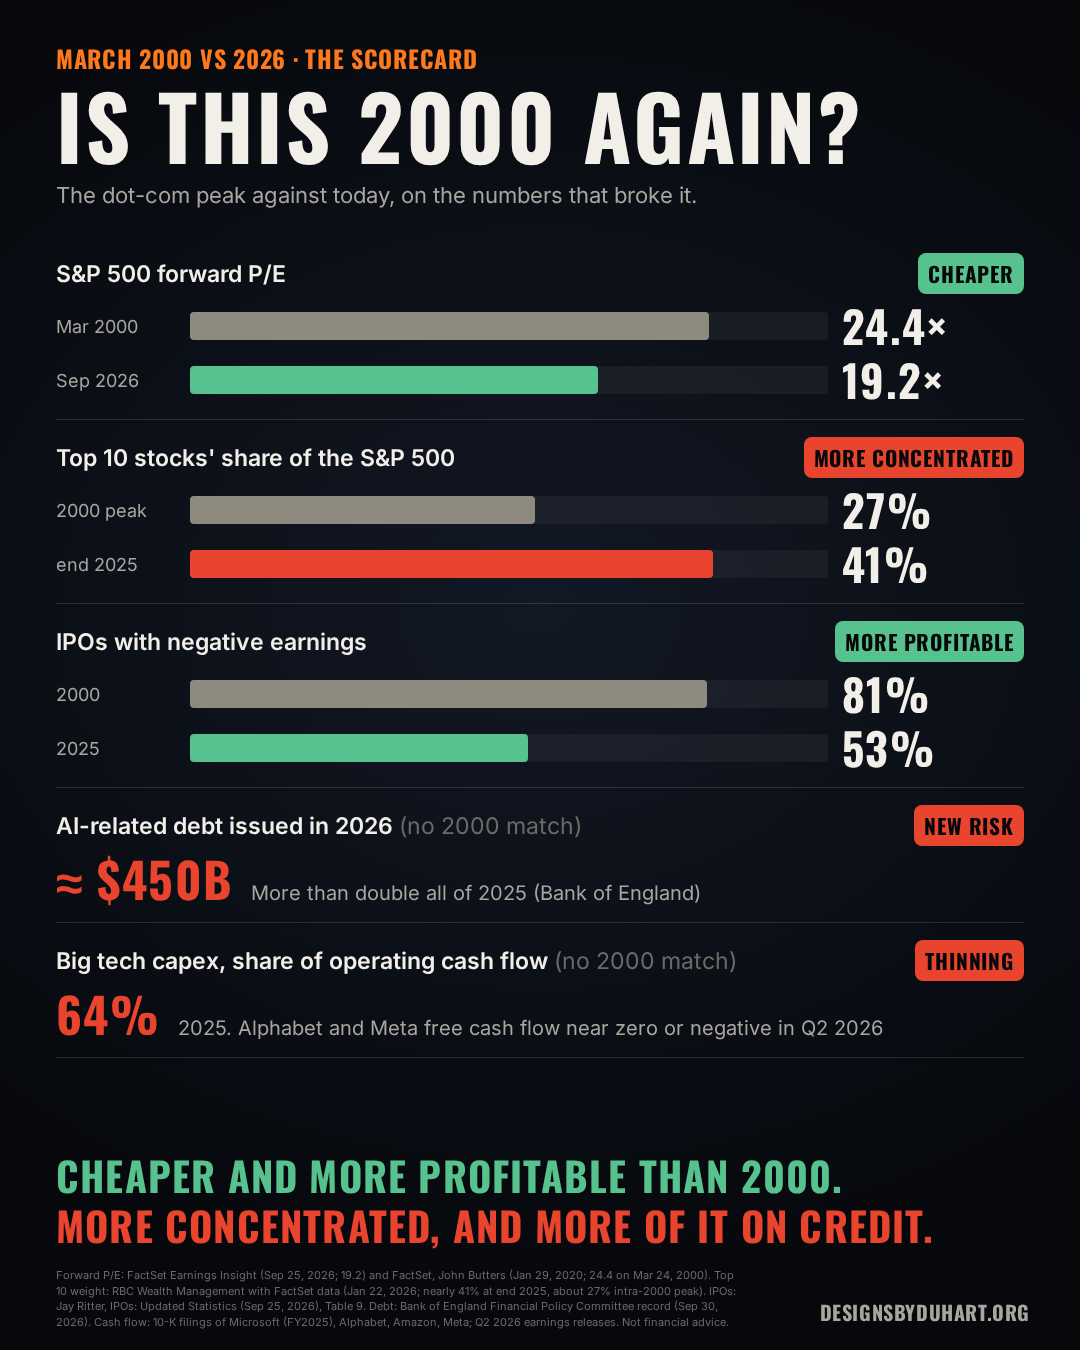
The comparison everybody reaches for is March 2000, so I put the two side by side on the numbers that broke the dot-com market.
- Valuation. The S&P 500 trades at 19.2 times next year's expected earnings (FactSet Earnings Insight, Sep 25, 2026). In March 2000 the same measure peaked at 24.4 (FactSet). Earnings have kept up with prices this time: since June 30, the index rose 2.7% while expected earnings rose 8.9%.
- The leader. Nvidia is worth about $5.5 trillion and earned $59.7 billion of net income in one quarter. By one count its forward P/E is around 17, the lowest since 2015 (24/7 Wall St, Sep 29, 2026); estimates vary a lot, but none I found look like a dot-com multiple.
- Profitability. 81% of the companies that went public in 2000 were losing money. In 2025 it was 53% (Jay Ritter, IPO statistics).
- Concentration. This is the one that is worse. The ten biggest stocks were nearly 41% of the S&P 500 at the end of 2025. The 2000 peak was about 27% (RBC Wealth Management, Jan 22, 2026). When most of an index rides on one trade, a stumble in that trade is everybody's problem, including people who think they own a boring index fund.
For scale on how bad it got last time: the Nasdaq Composite closed at 5,048.62 on March 10, 2000 and at 1,114.11 on October 9, 2002. That is a 78% fall (FRED, NASDAQCOM).
March 2000 vs 2026, the scorecard
The Jenga tower
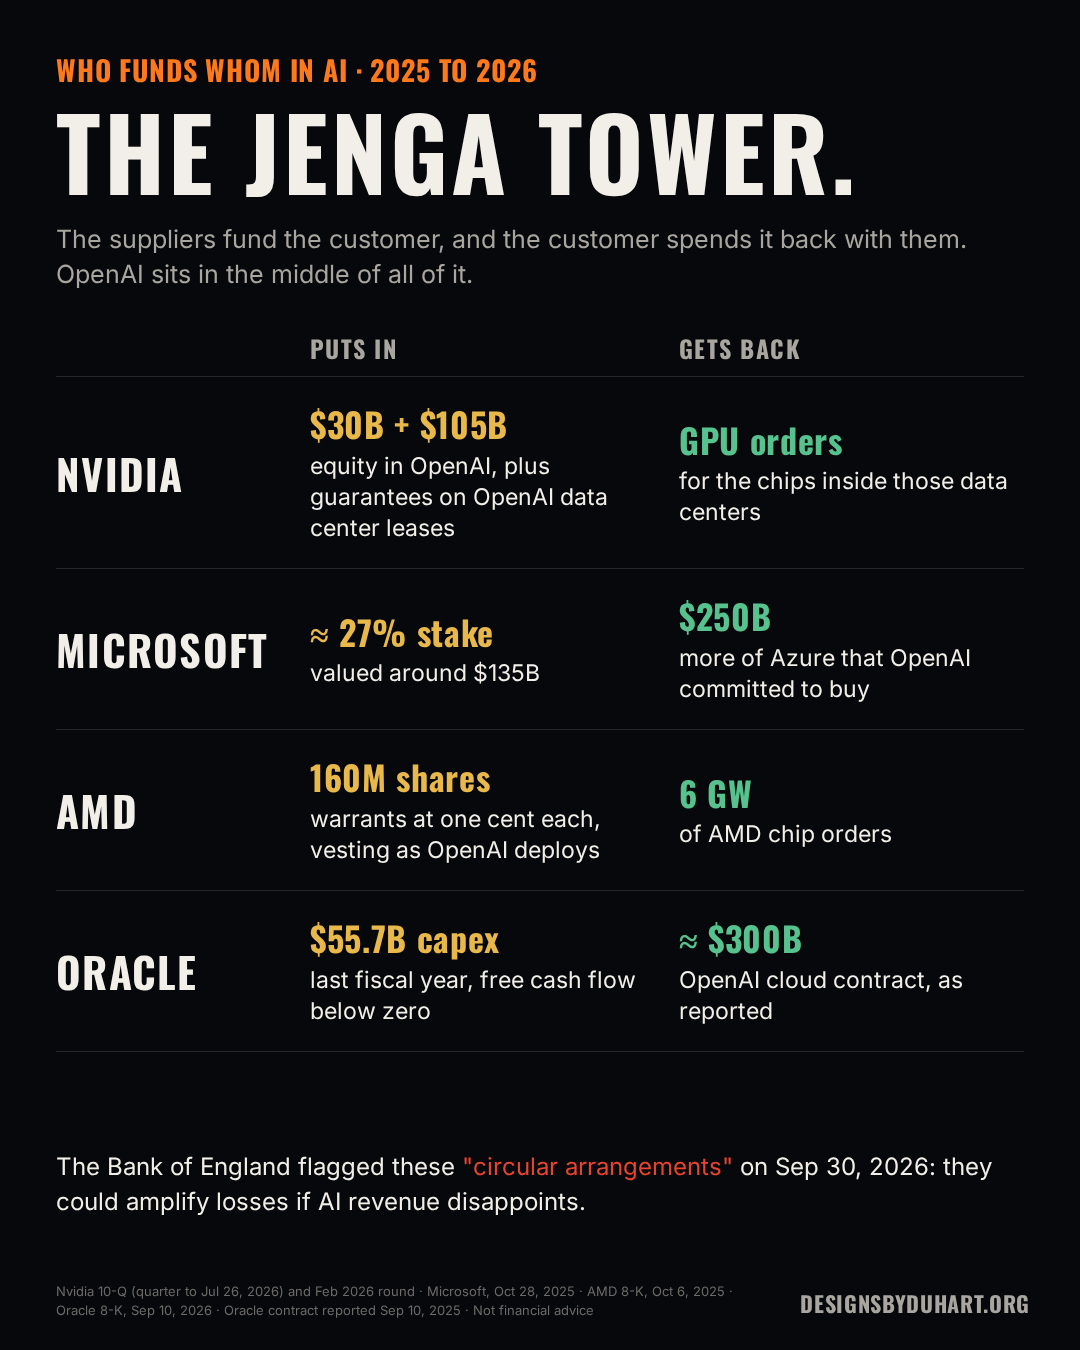
There is a scene in The Big Short where Ryan Gosling explains the mortgage market with a Jenga tower. Pull out the wrong block at the bottom and the whole thing comes down. I keep thinking about it when I read how AI is financed, because a lot of the money goes in a circle.
- Nvidia put $30 billion into OpenAI's funding round in February (Yahoo Finance). In August it agreed to guarantee, up to $105 billion, the leases on data centers built for an OpenAI affiliate. Those data centers are filled with Nvidia chips (Nvidia 10-Q, quarter to Jul 26, 2026). The same filing shows $99 billion of equity investments, $25 billion more committed, and one customer that was 16% of the quarter's revenue.
- Microsoft owns about 27% of OpenAI, and OpenAI committed to buy another $250 billion of Azure (Microsoft, Oct 28, 2025).
- AMD gave OpenAI warrants for up to 160 million AMD shares at one cent each, vesting as OpenAI deploys 6 gigawatts of AMD chips (AMD 8-K, Oct 6, 2025).
- Oracle reportedly signed a cloud contract with OpenAI worth about $300 billion over five years (SiliconANGLE, Sep 10, 2025), and now carries $664 billion of contracted future revenue it has not delivered yet.
None of this is hidden or illegal. Vendor financing is old. But it means part of the demand that justifies the spending is being paid for by the companies selling into it. The Bank of England called out exactly these "circular arrangements" on September 30, and warned that they could amplify losses (Financial Policy Committee record, Sep 2026).
Who funds whom
The debt, and the power bill
Here is what changed in 2026, and why I would watch it more closely than the stock prices.
For the first few years the buildout was paid for out of cash flow. In 2025 the big four spent about 64% of their operating cash flow on capex (10-K filings), which is aggressive but fine for companies that print money. In 2026 the margin ran out. In the second quarter Alphabet's free cash flow was negative $5.9 billion, Meta's was $0.8 billion and Meta borrowed $24.9 billion, and over the twelve months to June Amazon spent $173.0 billion on capex against $161.4 billion of operating cash flow. Alphabet sold $80 billion of new stock and convertibles in June to pay for AI infrastructure (Alphabet 8-K, Jun 1, 2026).
The Bank of England counts about $450 billion of AI-related debt issued worldwide so far in 2026, more than double all of 2025, and projects about $4.1 trillion of debt-financed AI spending from 2026 to 2030 (Bank of England, Sep 30, 2026). Debt is the part of a bubble that does the damage when it pops, because somebody has to keep paying it after the excitement is gone.
Then there is the electricity. Lawrence Berkeley National Laboratory found US data centers used 4.4% of the country's electricity in 2023 and projected 6.7% to 12% by 2028 (LBNL, Dec 2024). The International Energy Agency puts global data center use at about 485 terawatt hours in 2025, heading toward about 950 by 2030 (IEA). That bill lands on the grid and on ratepayers whether or not the AI revenue shows up.
What it is doing to the economy
AI spending is now big enough to move GDP. Using BEA's own data on FRED, investment in information processing equipment and software added 0.70 percentage points to US growth in 2025, about 30% of the 2.3% total. In the first quarter of 2026 it was 1.39 points of 2.5%, more than half. In the second quarter it fell to 0.52 points of 2.2% (FRED series Y034RY2Q224SBEA and B985RY2Q224SBEA). Jason Furman's widely shared estimate that it was 92% of growth in early 2025 used the data available then; the revised numbers put it closer to half. A real caveat: much of the hardware is imported, so part of that contribution leaves the country again. In the second quarter, imports of AI chips subtracted 1.7 points from growth (Fortune, Sep 30, 2026).
Adoption is real and rising. In the Census Bureau's survey, 23.8% of US firms said they used AI in some business function in the two weeks to September 6, up from 17.5% in early February (Census BTOS). That is still fewer than one in four. MIT's NANDA group reported in August 2025 that 95% of corporate generative AI pilots showed no measurable profit impact (Virtualization Review on the MIT report).
And productivity, the whole point, is decent but not a miracle yet. Output per hour in the nonfarm business sector grew 2.2% in the year to the second quarter of 2026 (BLS via FRED, PRS85006091). By my math on the same series it was about 2.9% in 2024 and about 2.2% in 2025. Good years. Not yet the kind of jump that pays back $730 billion a year.
The case that it is not a bubble
I want to give this side its full weight, because it is strong.
The dot-com bubble was built on companies that had no profits and often no revenue. This one is built on some of the most profitable companies that have ever existed. Nvidia made $59.7 billion of net income in one quarter on $96.2 billion of revenue, with a 75% gross margin, and guided to $108 billion for the next one (Nvidia, Aug 26, 2026). Microsoft, Alphabet, Amazon and Meta generated about $556 billion of operating cash flow in 2025.
The demand is not imaginary either. OpenAI's annualized revenue grew about 70% in a single quarter. Anthropic's run-rate went from about $9 billion at the end of 2025 to above $65 billion by July. Usage at that speed is not something a marketing budget buys.
And the market is not priced like 2000. A forward P/E of 19 is close to its own ten-year average of 19.0, and when the July sell-off came, it was absorbed: by late September the S&P 500 was back near a record. If you only looked at those numbers you would call it a boom, not a bubble.
What the data cannot say
- The start date is a choice. December 2022 makes every AI stock look huge, because it was near the bottom of the 2022 bear market. Start a year earlier and the gains shrink. I picked the month after ChatGPT because that is when the story started, and I am telling you I picked it.
- Local currencies. The map is in each market's own currency. In dollars, KOSPI, the Nikkei and the Bovespa would look different, and some of the gaps between countries are currency moves, not AI.
- Annualized revenue is not annual revenue. OpenAI's $70 billion and Anthropic's $65 billion are the latest month or so multiplied out. Anthropic's actual revenue for all of 2025 was $4.6 billion. Run-rates at companies growing this fast are real signals and also the most optimistic way to state the number.
- Not all capex is AI. Some of that $733 billion is warehouses, ordinary cloud servers and offices. The companies do not break out the AI share, so the gap chart overstates it somewhat.
- 2026 is guidance. The 2026 bar is what the companies said they would spend, not what they spent, and Microsoft's number moved with an accounting change in the same quarter.
- The Sequoia math is a rule of thumb. Doubling twice is one investor's way of reasoning about it, not a law. If chips last longer than people assume, the bill gets smaller. If they last less time, it gets bigger.
- Bubbles are only certain afterwards. Nobody, including me, can tell you the date. A lot of people called 1997 a bubble and were right three years too early.
So, bubble or base camp?
My read: not 2000 yet. Watch the debt.
The prices are not at dot-com levels, the companies doing the spending are real businesses, and the revenue is growing faster than the skeptics expected, me included. That is base camp.
But the spending is outrunning the revenue by a wide margin, the money is starting to go in a circle, the leaders are now borrowing to keep the pace, and more of the stock market rides on this one trade than rode on the internet in 2000. That is how the air gets thin. If this ends badly, I do not think it starts with a stock chart. I think it starts with a debt payment somebody cannot make.
Remember where you started. Semis are about five times where they were in December 2022. That is either the first leg of a long climb or the top of a very expensive hill, and the next two years of revenue will decide which.
So I will ask it the way the map asks it. Bubble or base camp? Where do you land, and what number would change your mind?
Next week: debt reallocation, and where all this borrowing is coming from.
Sources
Markets (the map and the terrain): monthly closes from Yahoo Finance, December 2022 to September 2026, each market in its own currency, rebased to December 2022. Semiconductor index correction: NBC News.
Capex and cash flow: 10-K and 10-Q filings via SEC EDGAR (purchases of property and equipment; Amazon's purchases of property and equipment; Meta's finance lease principal for its guidance basis). Alphabet Q2 2026 · Meta Q2 2026 · Microsoft FY26 Q4 · Microsoft 2026 plans, CFO Dive · Amazon guidance, The Motley Fool · Oracle Q1 FY27 · Alphabet equity raise
AI revenue: OpenAI, Axios via PYMNTS · Anthropic run-rate, Bloomberg · Anthropic draft S-1, Fortune · Microsoft AI run-rate · Sequoia, AI's $600B Question · Nvidia Q2 FY2027
Valuation and concentration: FactSet Earnings Insight, Sep 25, 2026 · FactSet on the March 2000 peak · RBC Wealth Management on concentration · Nvidia valuation, 24/7 Wall St · Jay Ritter, IPO statistics · FRED, Nasdaq Composite · Federal Reserve Financial Stability Report, May 2026
Circular deals: Nvidia 10-Q · Nvidia in OpenAI's round · Microsoft and OpenAI · AMD 8-K · Oracle and OpenAI, SiliconANGLE
Debt and power: Bank of England FPC record, Sep 2026 · LBNL data center energy report · IEA, Key Questions on Energy and AI
Economy: FRED, equipment contribution to GDP growth · FRED, software contribution · Fortune on Q2 GDP · Census Business Trends and Outlook Survey · BLS productivity via FRED
Not financial advice. I build data pipelines; I do not manage money.
Next: Debt Reallocation. Where all this borrowing is coming from, and who is holding it.
More: LinkedIn · Instagram. Portfolio and case studies: designsbyduhart.org.
If any of this saved you an afternoon, Buy me a coffee.