Spotify's Danceability Score Doesn't Match What People Feel. Here's What Rhythm Really Measures
A 2026 study found Spotify's danceability did not track 244 listeners. My rhythm stage measures seven defined things instead; here they are on 3,141 tracks.
A score that does not match what people feel
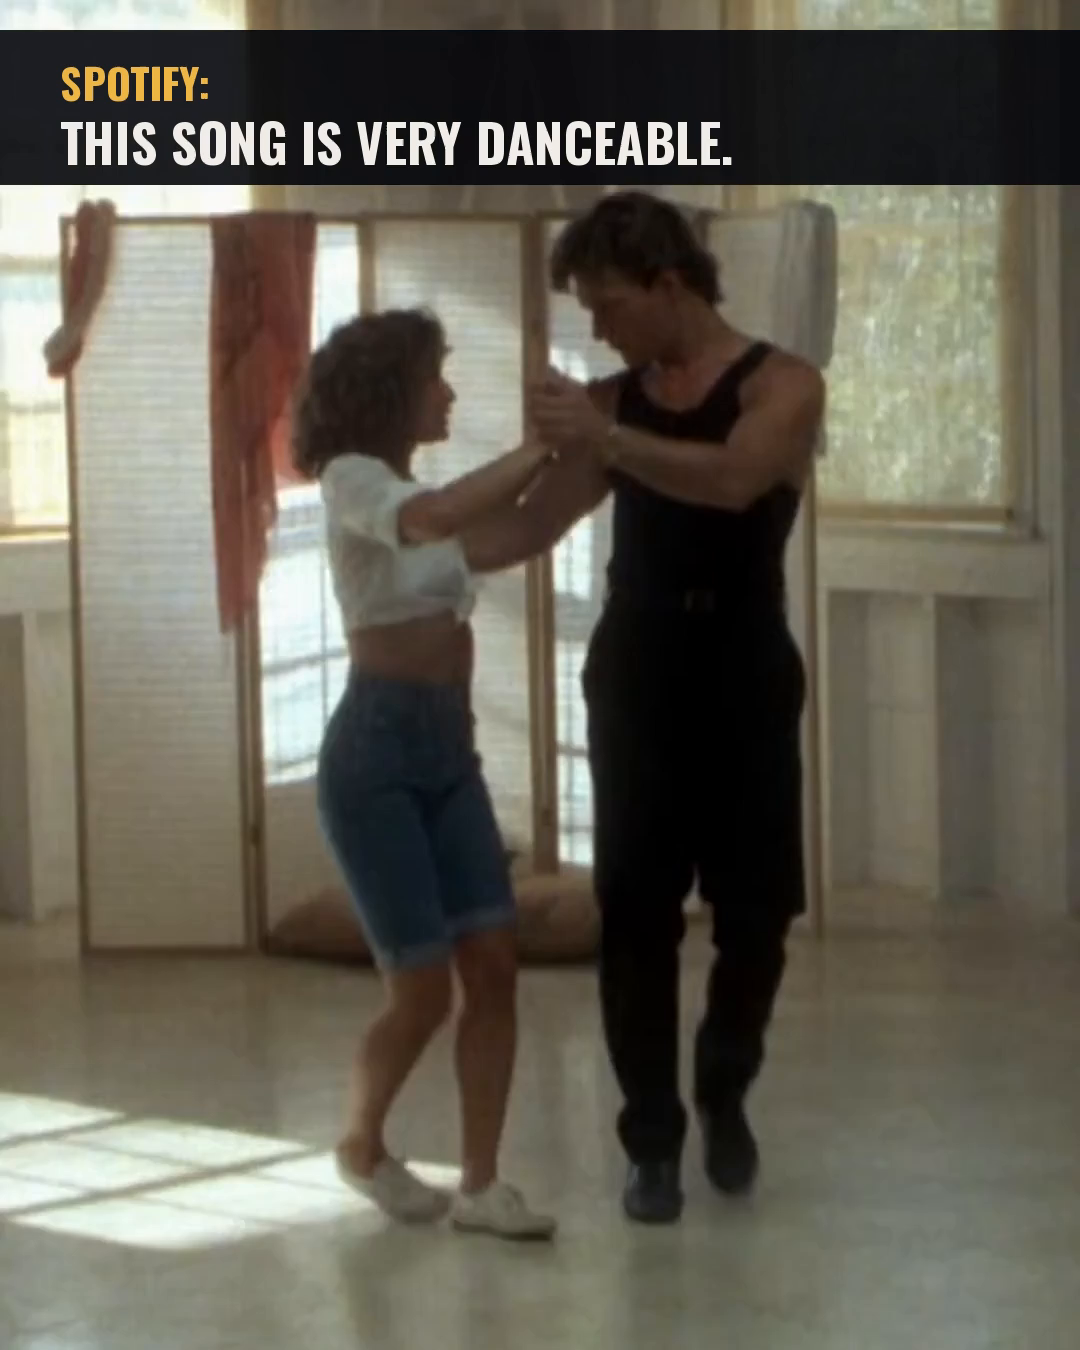
Spotify's audio features gave every track a danceability score, and developers built apps on it. In 2026 Dianna Vidas, Lewis Nitschinsk, Margaret S. Osborne and Nikki S. Rickard tested it in Music Perception: 244 people rated 40 song excerpts for mood, energy and danceability. Spotify's energy and valence were associated with the listeners' ratings. Danceability was not strongly associated with how they rated danceability.
Spotify has since closed that endpoint to new apps. I run my own streaming platform, so I compute rhythm from raw audio instead. This is part 9 of 14, and the rule for this one is simple: every number gets a definition, and nothing gets called danceability.
Rhythm, in a 40 second skit
Seven rhythm numbers
The rhythm stage reads the same onset envelope and beat grid as the tempo stage (part 8) and adds a harmonic/percussive split:
- onset rate: detected onsets per second (catalogue median 4.18)
- onset strength, mean and standard deviation, relative to the loudest onset
- beat regularity: 1 minus the coefficient of variation of the beat intervals (median 0.964)
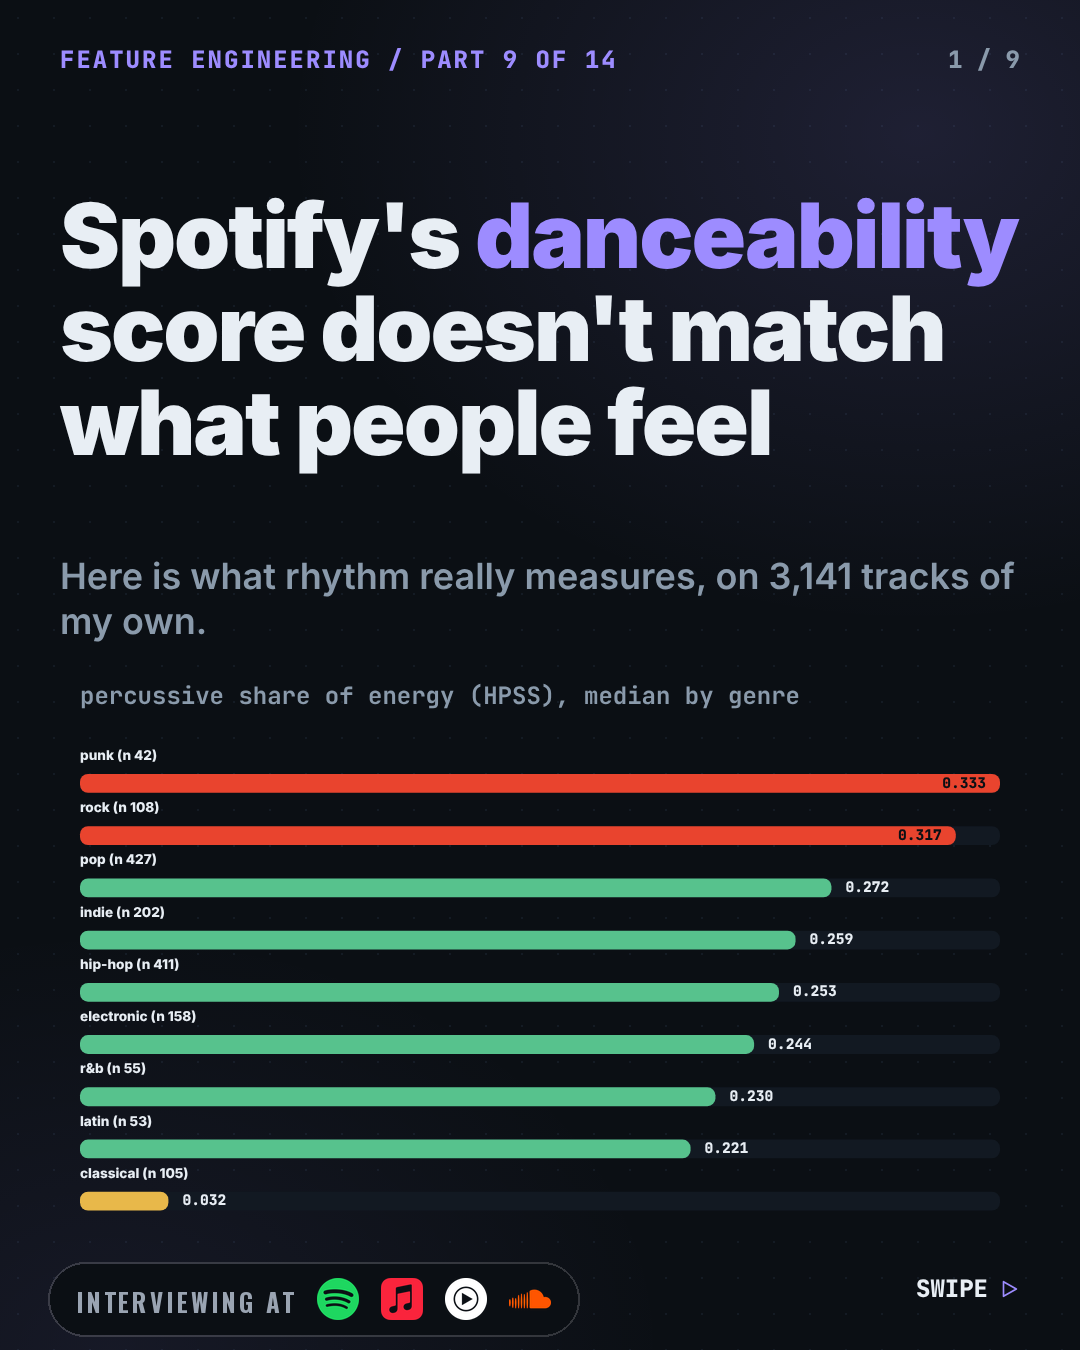
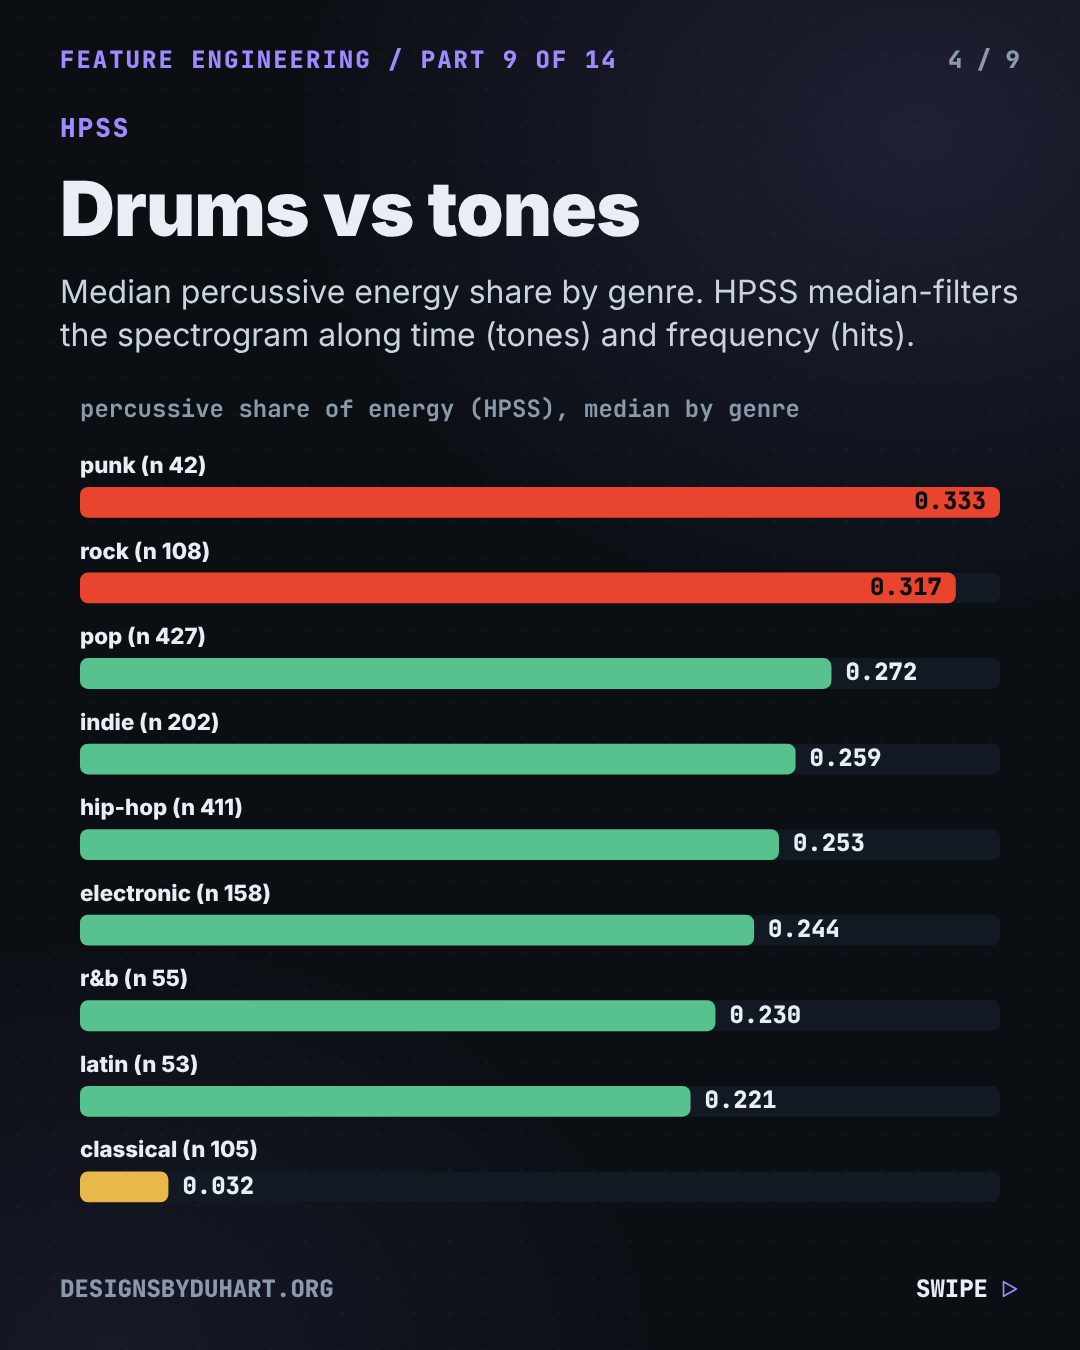
- percussive ratio: the share of spectrogram energy HPSS assigns to the percussive part (median 0.259)
- syncopation: a proxy, defined below (median 0.246)
- tempo stability: 1 minus the coefficient of variation of local tempo, folded to one octave so a 120/60 flip is not counted as a tempo change (median 0.921)
HPSS runs with a median kernel of 17, not librosa's 31: a third faster, and indistinguishable for energy ratios and chroma masking.
Drums vs tones, by genre
The syncopation proxy, from rhythm_analysis.py in my signal engine
if len(grid.beat_times) >= 2 and len(onsets):
    interval = float(np.median(ivl)) if len(ivl) else None
    if interval and interval > 0:
        half = interval / 2.0
        bt = grid.beat_times
        eighths = np.sort(np.concatenate([bt, (bt[:-1] + bt[1:]) / 2.0]))
        d = np.abs(onsets[:, None] - eighths[None, :]).min(axis=1) / half
        sync = float((d > 0.30).mean())
Why the syncopation proxy says classical beats pop
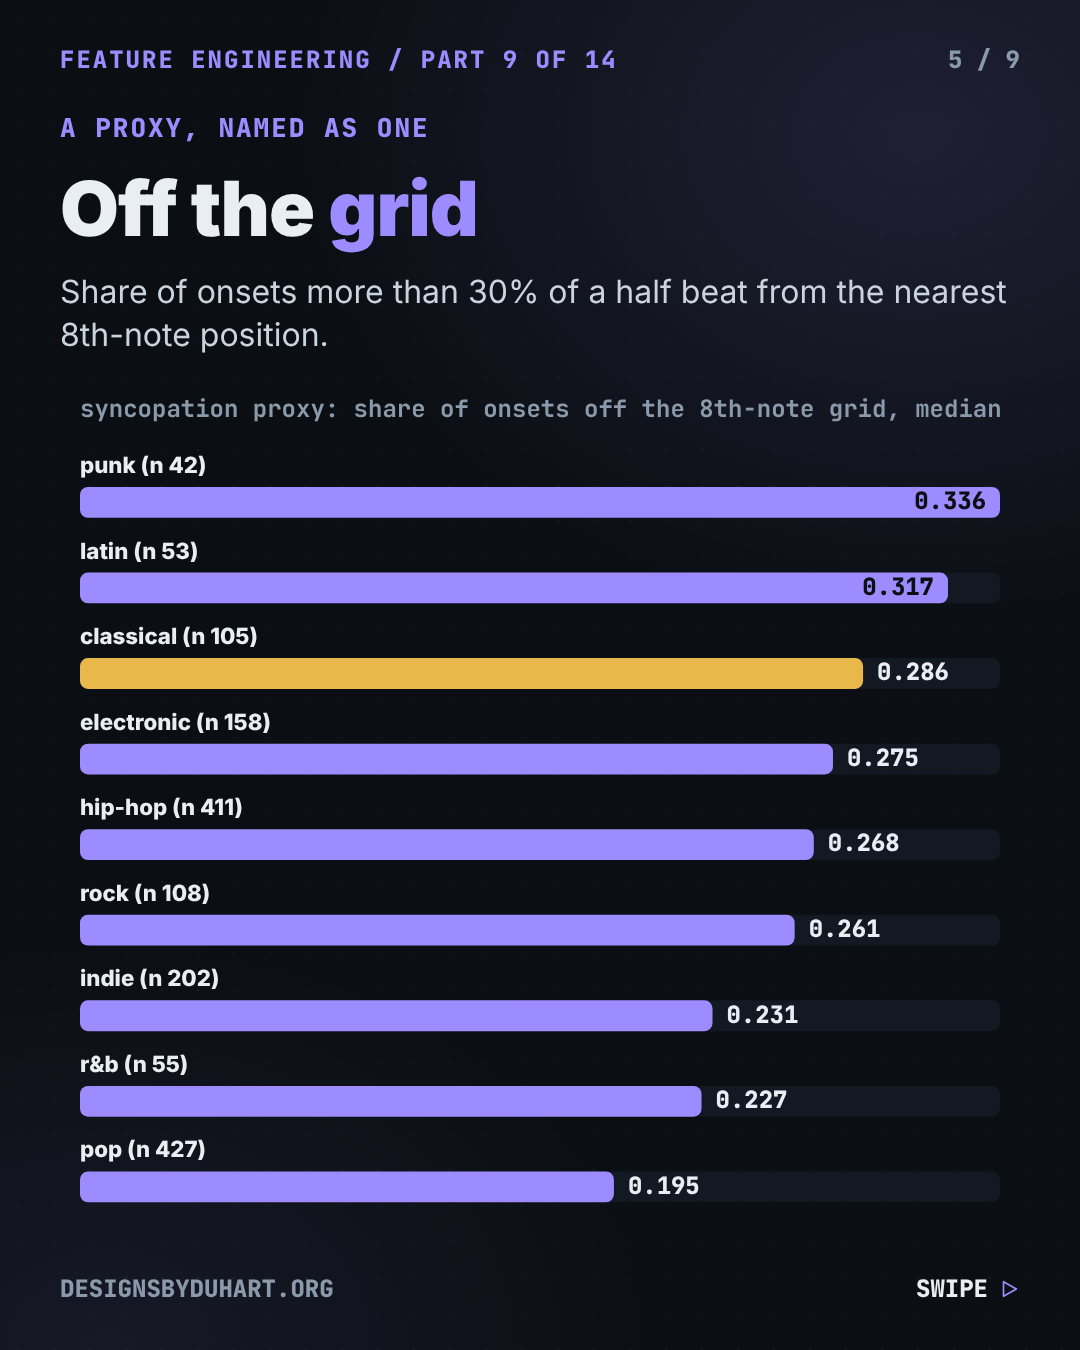
The proxy counts onsets that land more than 30% of a half beat away from the nearest 8th-note position. Straight pop reads low (0.195), latin and punk read high (0.317 and 0.336). Classical reads 0.286, higher than pop, and not because orchestras swing: a performance that takes its time drifts off any fixed grid, and the beat tracker still lays one down. That is why the code calls it a proxy and names it for what it correlates with.
Two songs from my library show the range. Another One Bites the Dust (Queen) has a percussive share of 0.678 and syncopation 0.101: a heavy, on-grid groove. The Jack Wins remix of Rockabye (Clean Bandit), the music under the video, reads 0.499, inside the top 5% of my catalogue (above 0.457), with 6.05 onsets a second.
Rhythm by genre
What I can and cannot claim
I can claim that each of these numbers means what its definition says, and the engine tests that on known signals: a 120 BPM click must read 120 BPM with regularity above 0.9. I cannot claim they predict how danceable people find a song. I have not tested them against human ratings, and I am not claiming they beat Spotify's score. What the study shows is that a single opaque number needs that test before you trust it.
Part 9 of 14, next: How an Algorithm Finds the Key of Any Song (and Why DJs Care)
Part 9 of 14, next: How an Algorithm Finds the Key of Any Song (and Why DJs Care)
More: LinkedIn · Instagram. Portfolio and case studies: designsbyduhart.org.
If any of this saved you an afternoon, Buy me a coffee.