How Shazam Sees a Song: The Spectrogram Behind My Music AI
The spectrogram explained through Shazam's constellation map, with my own recogniser's numbers: 10 s of Giorgio by Moroder becomes 1,070 peaks and 6,385 32-bit hashes, while the feature engine keeps the whole mel picture.
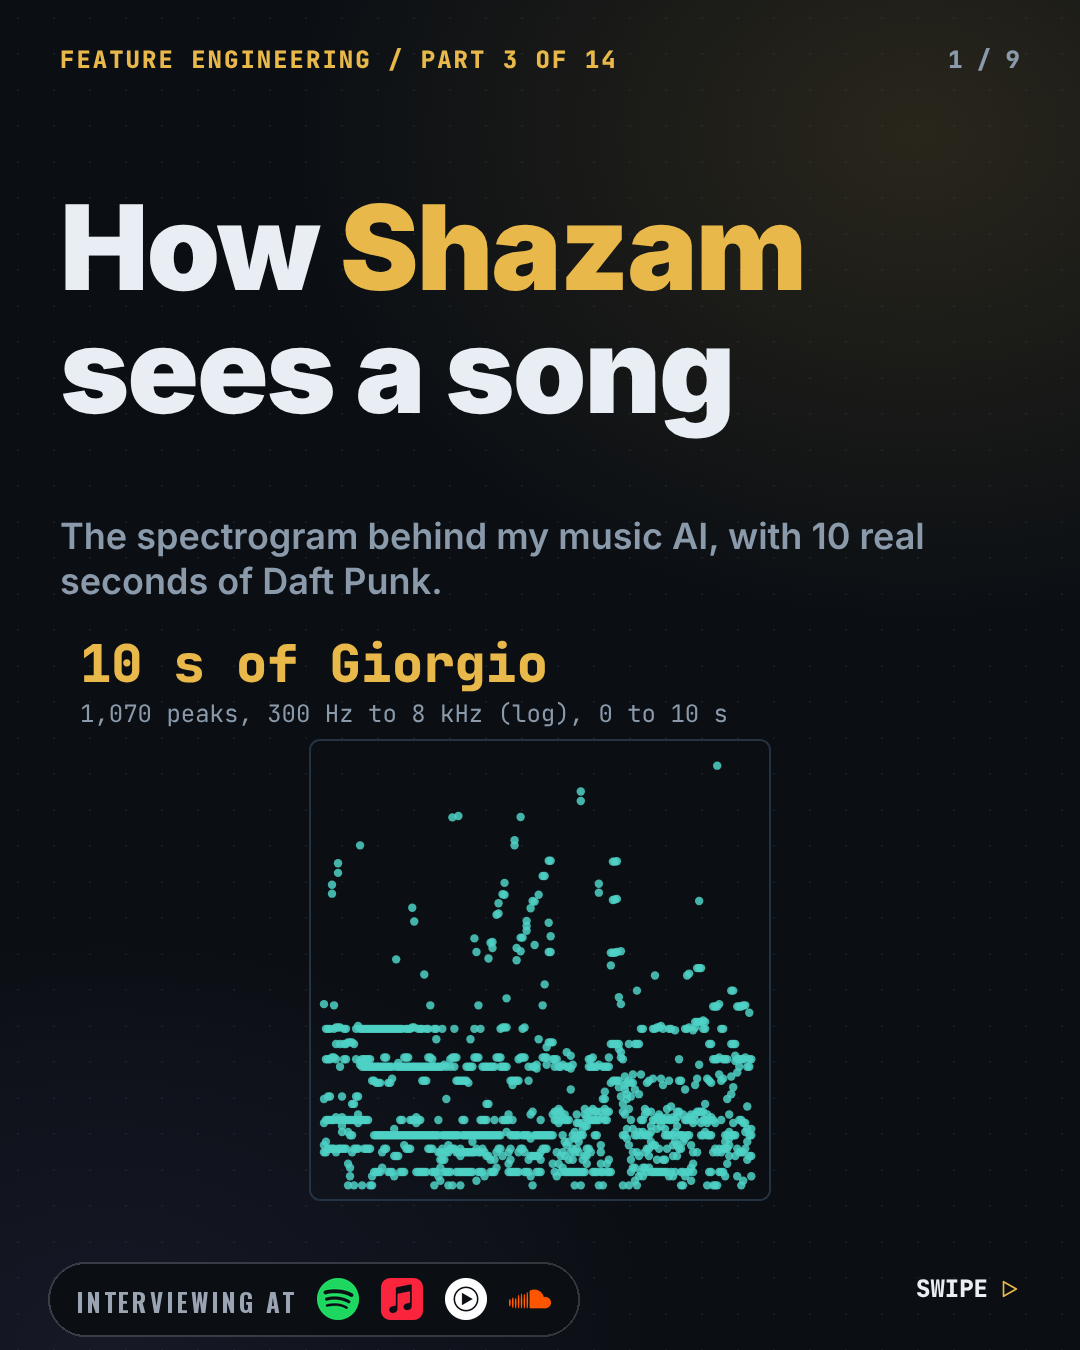
Shazam looks at your song
In 2003 Avery Wang described how Shazam finds a song in a noisy room (An Industrial-Strength Audio Search Algorithm, ISMIR 2003). It does not compare sound. It computes a spectrogram, keeps only the peaks, "robust in the presence of noise", and calls the result a constellation map, because the dots look like a star field.
My music service has the same kind of recogniser, Jamz, and a feature engine that starts from the same maths and keeps the opposite thing.
Two spectrograms in 40 seconds

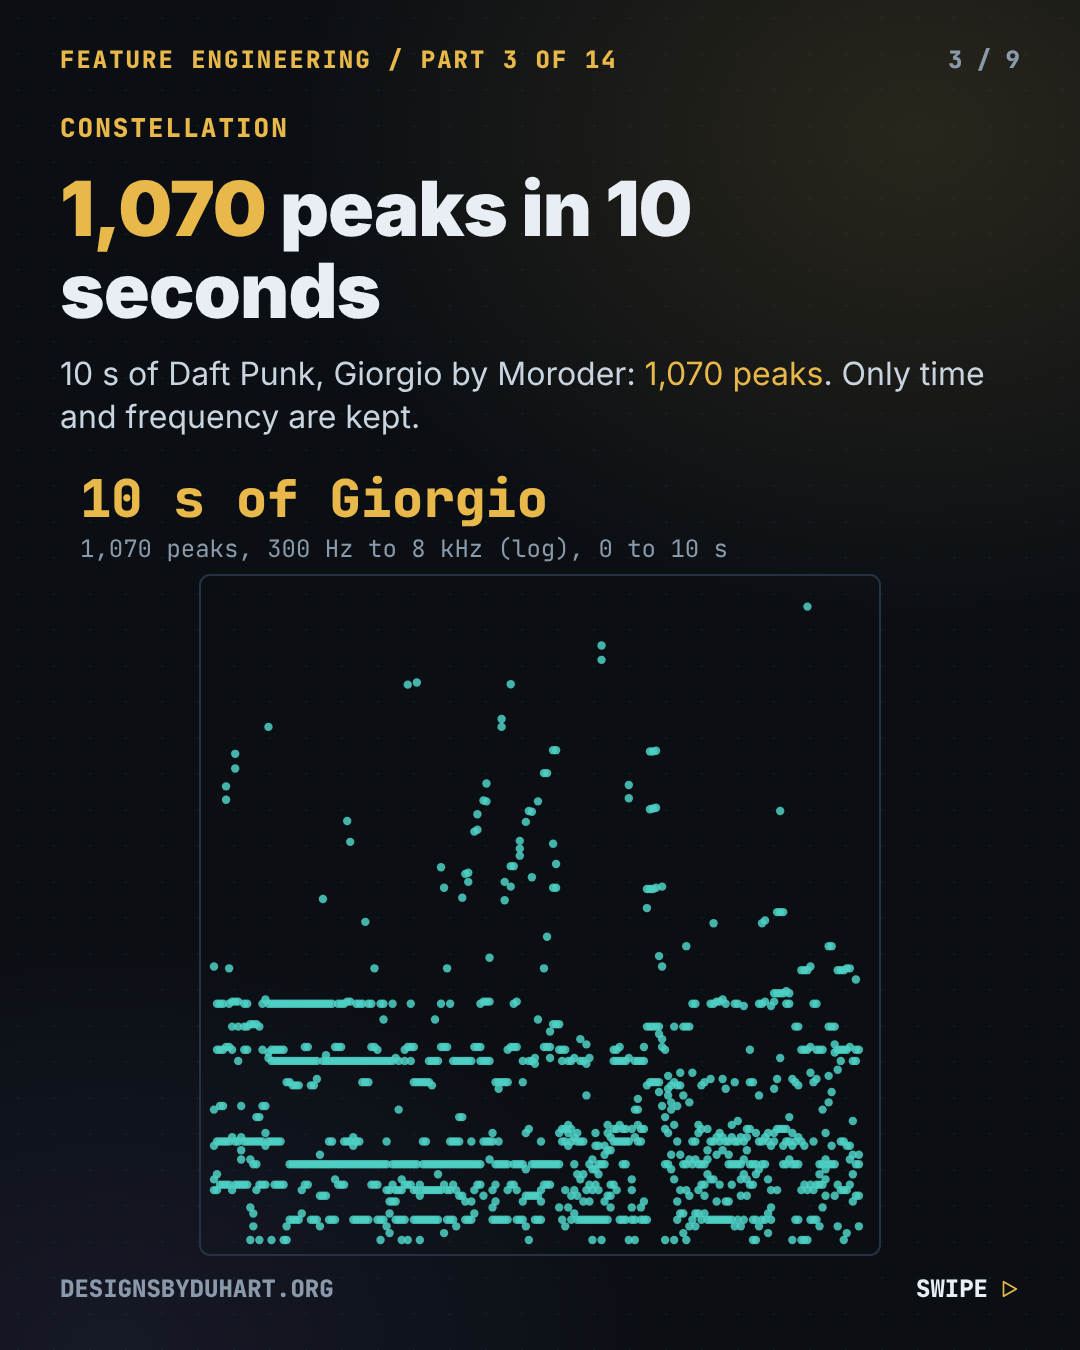
The constellation map
Jamz: 44,100 Hz, a 4,096-point FFT every 2,048 samples (a Hann window), the 5 strongest peaks per frame between 300 and 8,000 Hz and above -60 dB. Re-running those settings on 10 seconds of Giorgio by Moroder (from the 60 s my feature engine analyses): 214 frames, 1,070 peaks. Amplitude is thrown away; only time and frequency are kept.
The constellation map
workers/billboard_users/src/JamzFingerprintDO.ts: hash packing
const anchorBin  = anchor.binIndex  & 0x3FF;   // 10 bits
const targetBin  = target.binIndex  & 0x3FF;   // 10 bits
const deltaUnits = Math.floor(deltaTime / 10) & 0xFFF; // 12 bits, 10ms resolution

const hash = ((anchorBin << 22) | (targetBin << 12) | deltaUnits) >>> 0; // unsigned
Each peak is an anchor paired with up to 6 later peaks within 500 ms. Wang: "each hash can be packed into a 32-bit unsigned integer". Mine packs 10 + 10 + 12 bits. Those 10 seconds give 6,385 hashes, 2,427 distinct.
The mel view, for features
The feature engine resamples to 22,050 Hz and runs a 2,048-point window with a 512 hop, then maps the power spectrum onto 128 mel bands, spaced the way hearing spaces pitch, in dB. One STFT, mel and harmonic/percussive split is computed once and shared by every analyzer, and 5 s log-mel patches (float16, about 0.7 MB per track) feed the CNN.
The two settings have the same frequency detail, 10.8 Hz per bin (22,050 / 2,048 and 44,100 / 4,096), but the feature STFT steps every 23.2 ms and Jamz every 46.4 ms.
Two songs, 128 mel bands
In energy terms (power below 250 Hz, 250 Hz to 4 kHz, above 4 kHz): Giorgio by Moroder is 88 % low, 12 % mid; bad guy is 26 % low, 73 % mid.
The catch
The catalogue is fingerprinted on the server (a C FFT compiled to WebAssembly), the query on the phone (Apple's vDSP) and the web keeps a third copy. As the C file's own header says: if the two disagree about which peaks a frame contains, the hashes never collide and recognition fails silently, no error, just no matches. So the window scaling, vDSP's factor of 2 and the power-mode dB are pinned constant by constant.
Part 3 of 14, next: Classical vs Punk: Why They Sound Different, in Numbers.
Part 3 of 14, next: Classical vs Punk: Why They Sound Different, in Numbers.
More: LinkedIn · Instagram. Portfolio and case studies: designsbyduhart.org.
If any of this saved you an afternoon, Buy me a coffee.