Ranked: The World's 40 Richest Cities by GDP Per Person
San Jose is the final boss at $238,700 per person, about $57,000 ahead of San Francisco. 27 of the 40 are American.
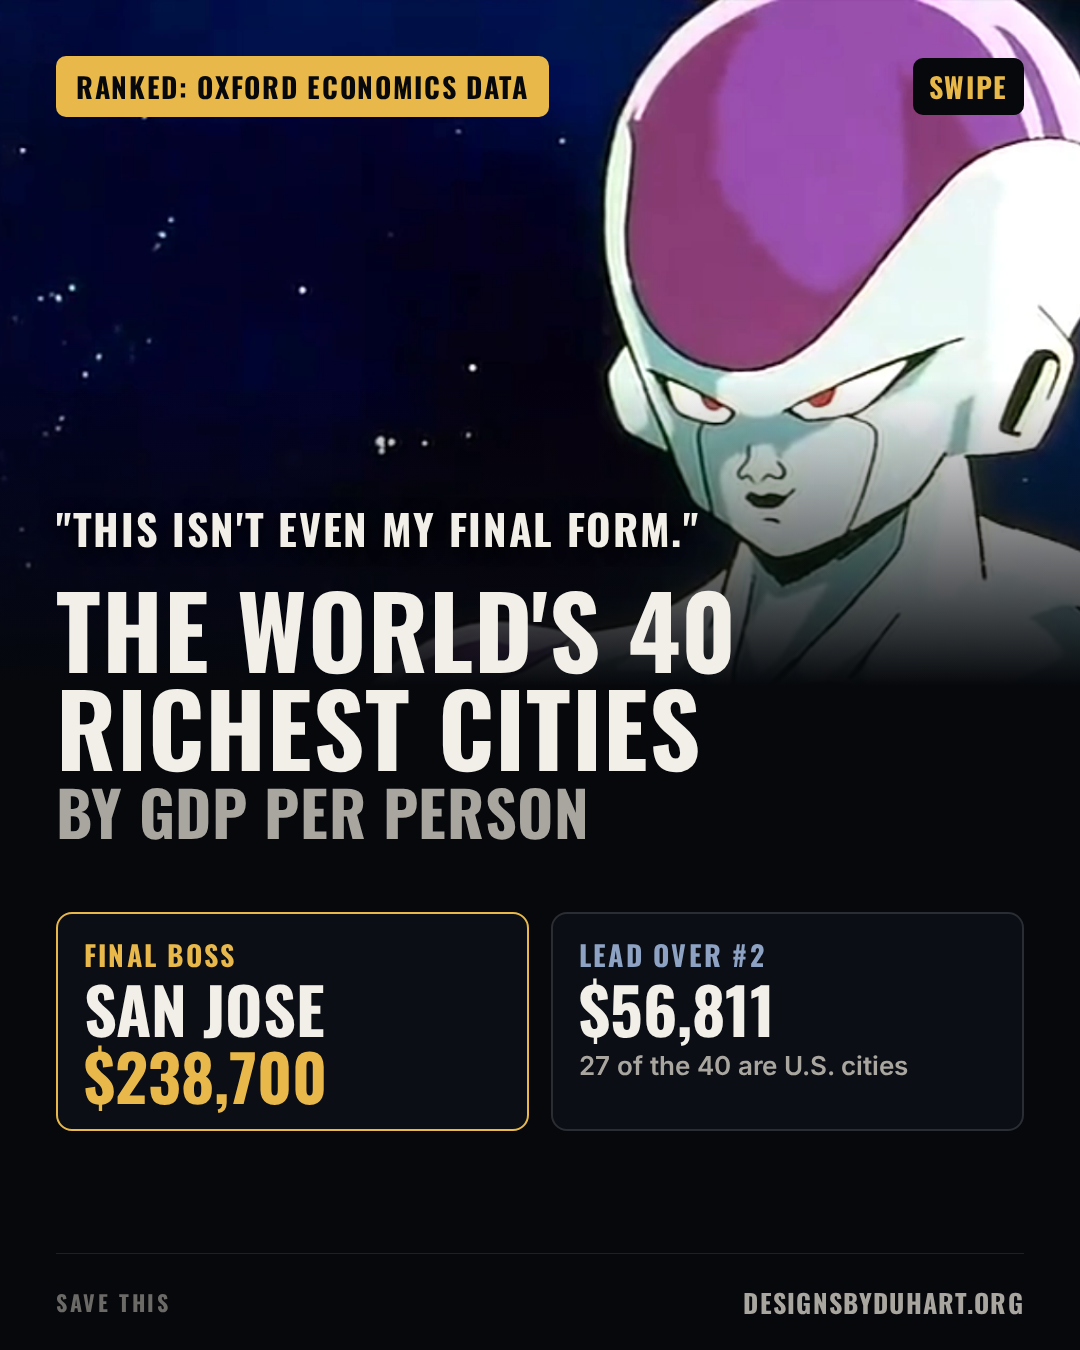
Visual Capitalist ranked the 40 richest cities by GDP per person using Oxford Economics' 2026 Global Cities Index, and the top of the list reads like a boss fight. San Jose is at $238,700 per person. San Francisco is second at $181,889. Nobody else is close.
I rebuilt the chart and checked what I could against Oxford's own words. I'll be upfront about one thing first: Oxford publishes the full city tables only inside a report you get by filling in a form. So the city values here are Oxford's numbers as Visual Capitalist published them, and I say where each one came from.
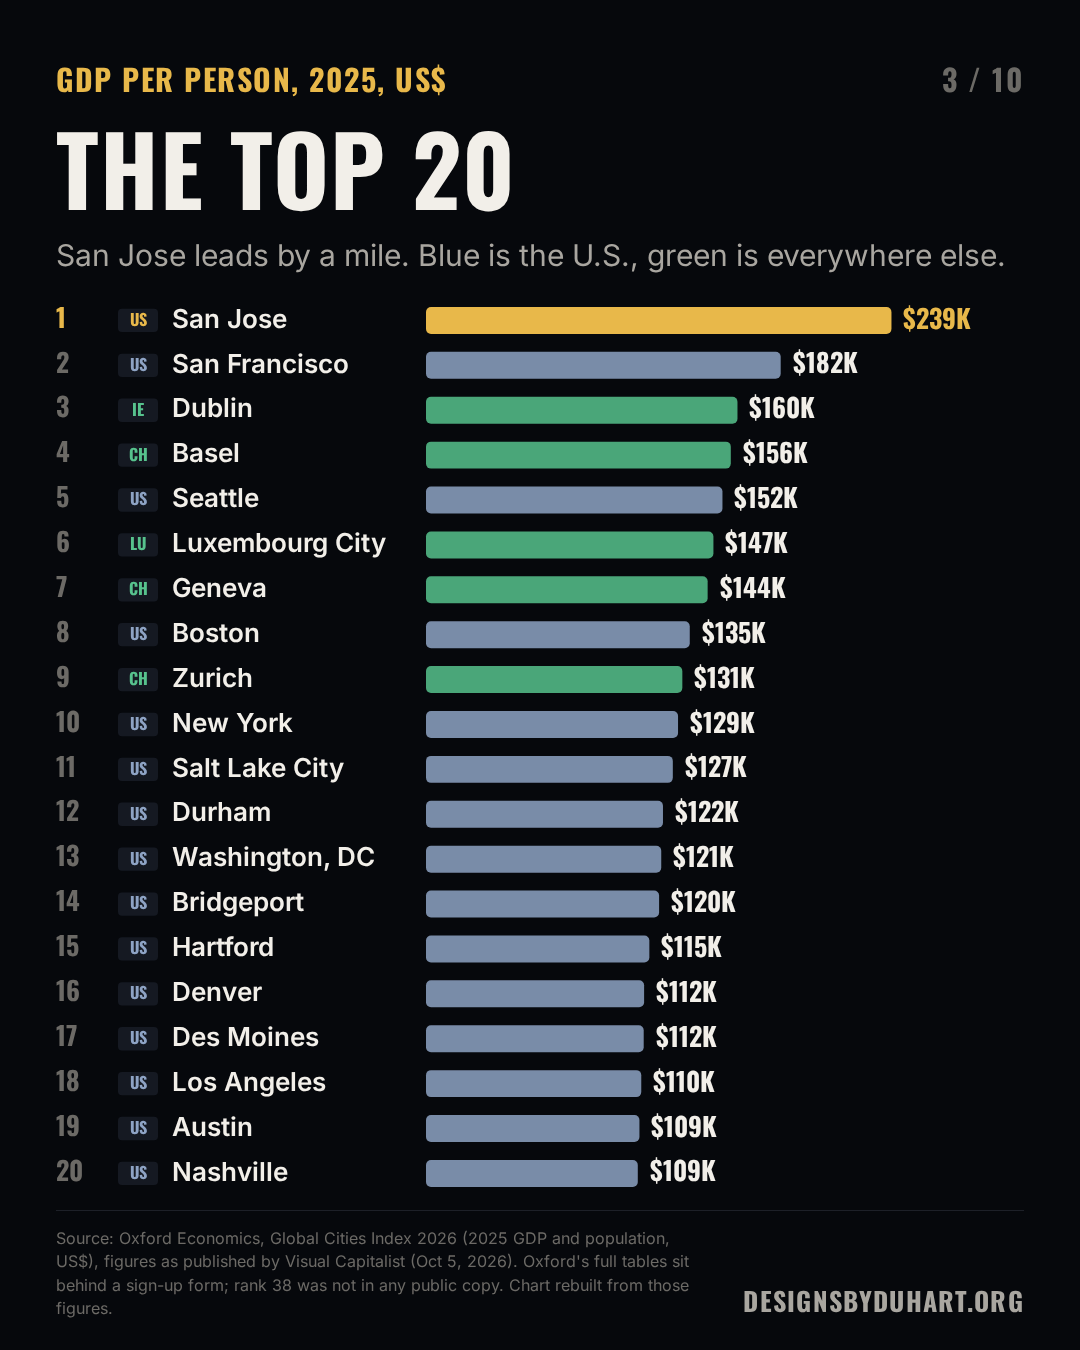
The 40 richest cities by GDP per person
The 40 cities, as spikes
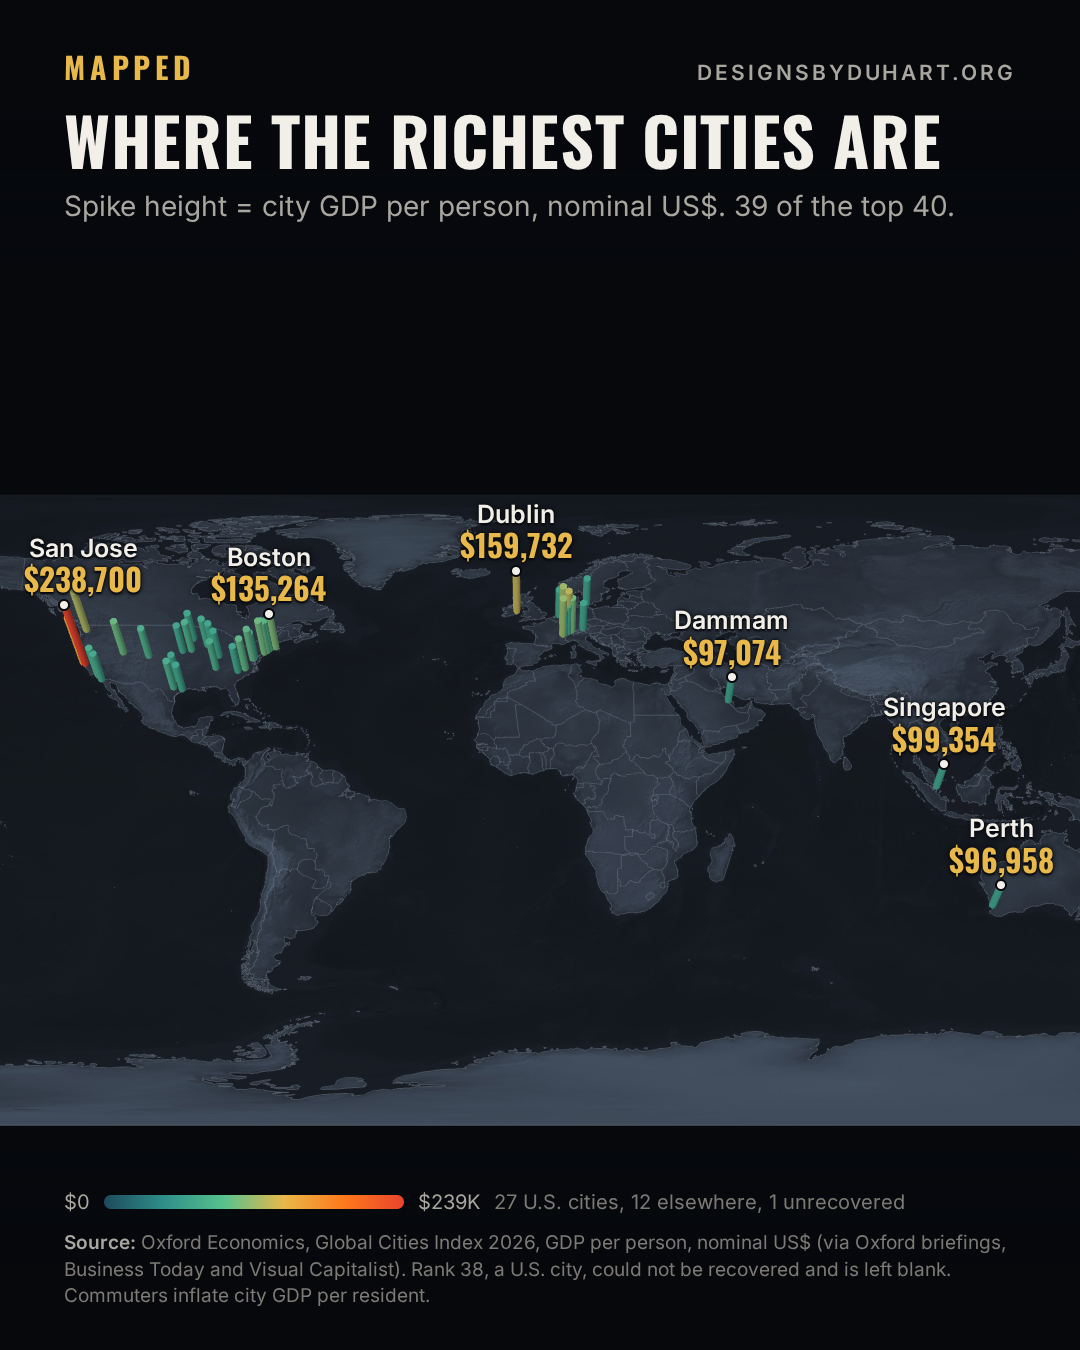
Explore the city spikes
The final boss
Oxford's own briefing says San Jose has the highest GDP per person of all 1,000 cities in the index, and its chart of U.S. metros puts San Jose at the far end of the axis, around $239,000. Visual Capitalist's $238,700 fits both.
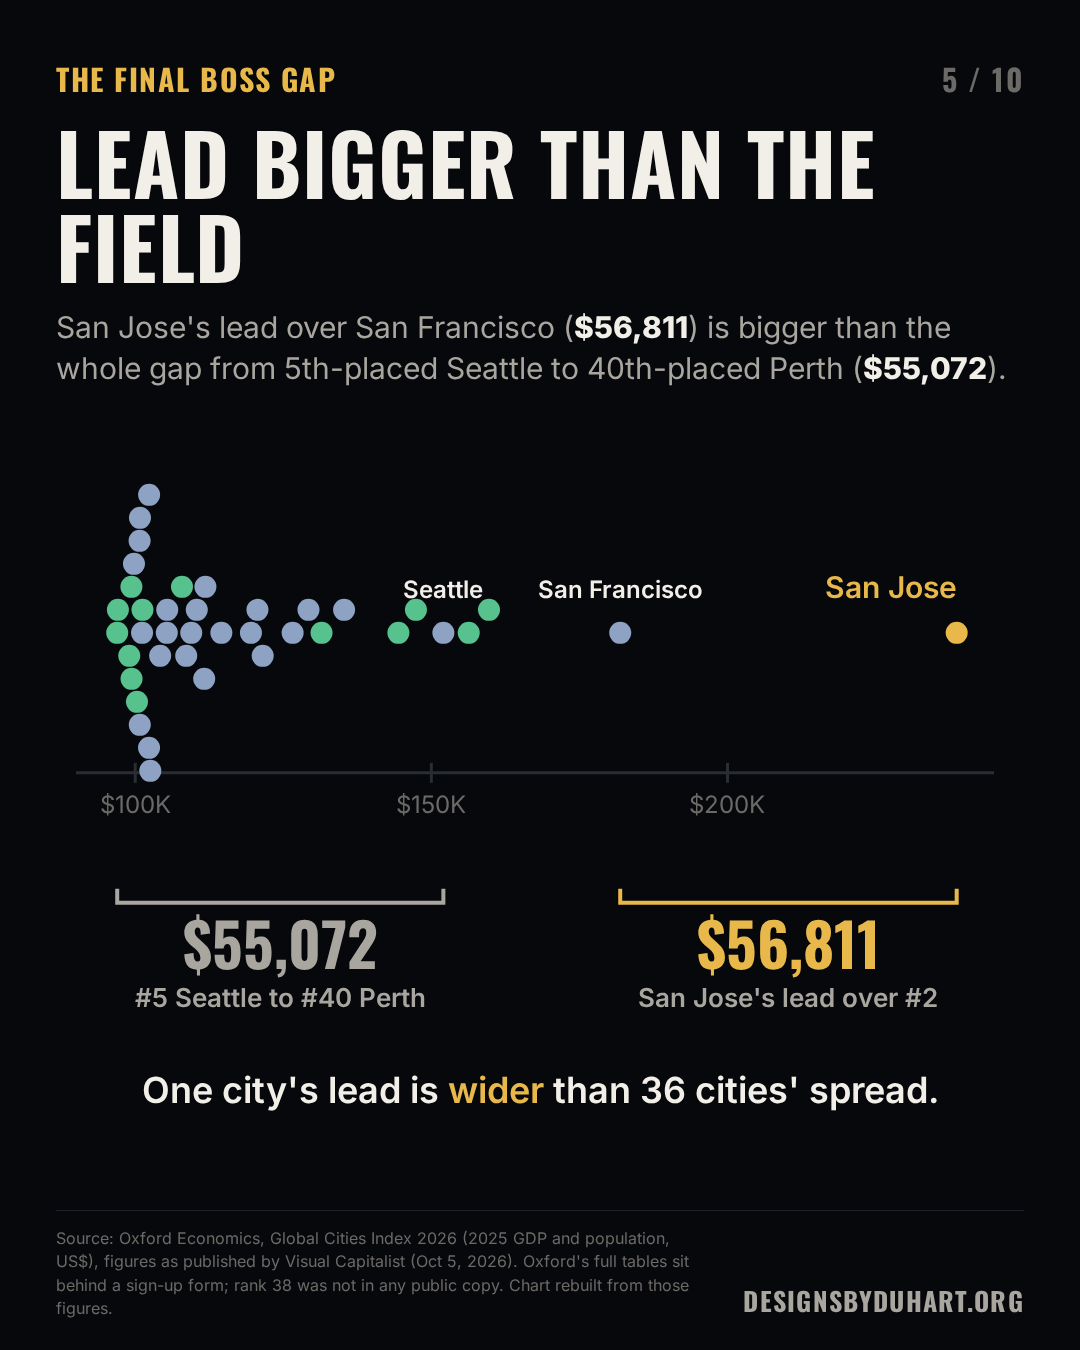
The size of the lead is the striking part. San Jose is $56,811 ahead of San Francisco. The whole distance from 5th place (Seattle, $152,030) to 40th (Perth, $96,958) is $55,072. One city's lead is bigger than the field.
A lead bigger than the field
All 40, animated
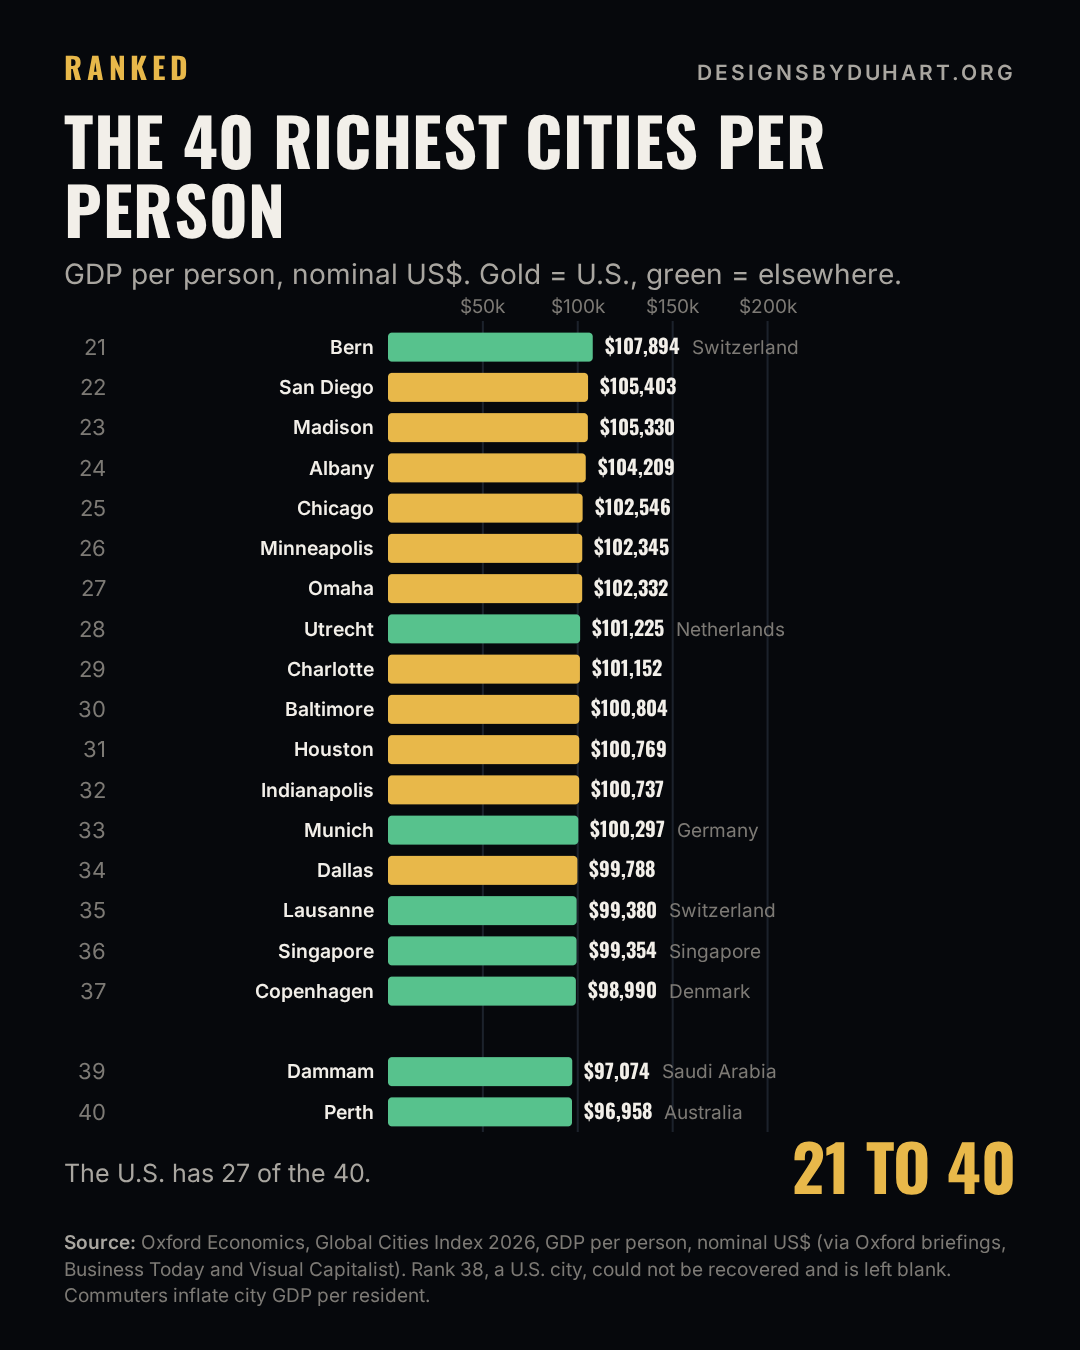
The 40 second anime version

Ranks 21 to 40
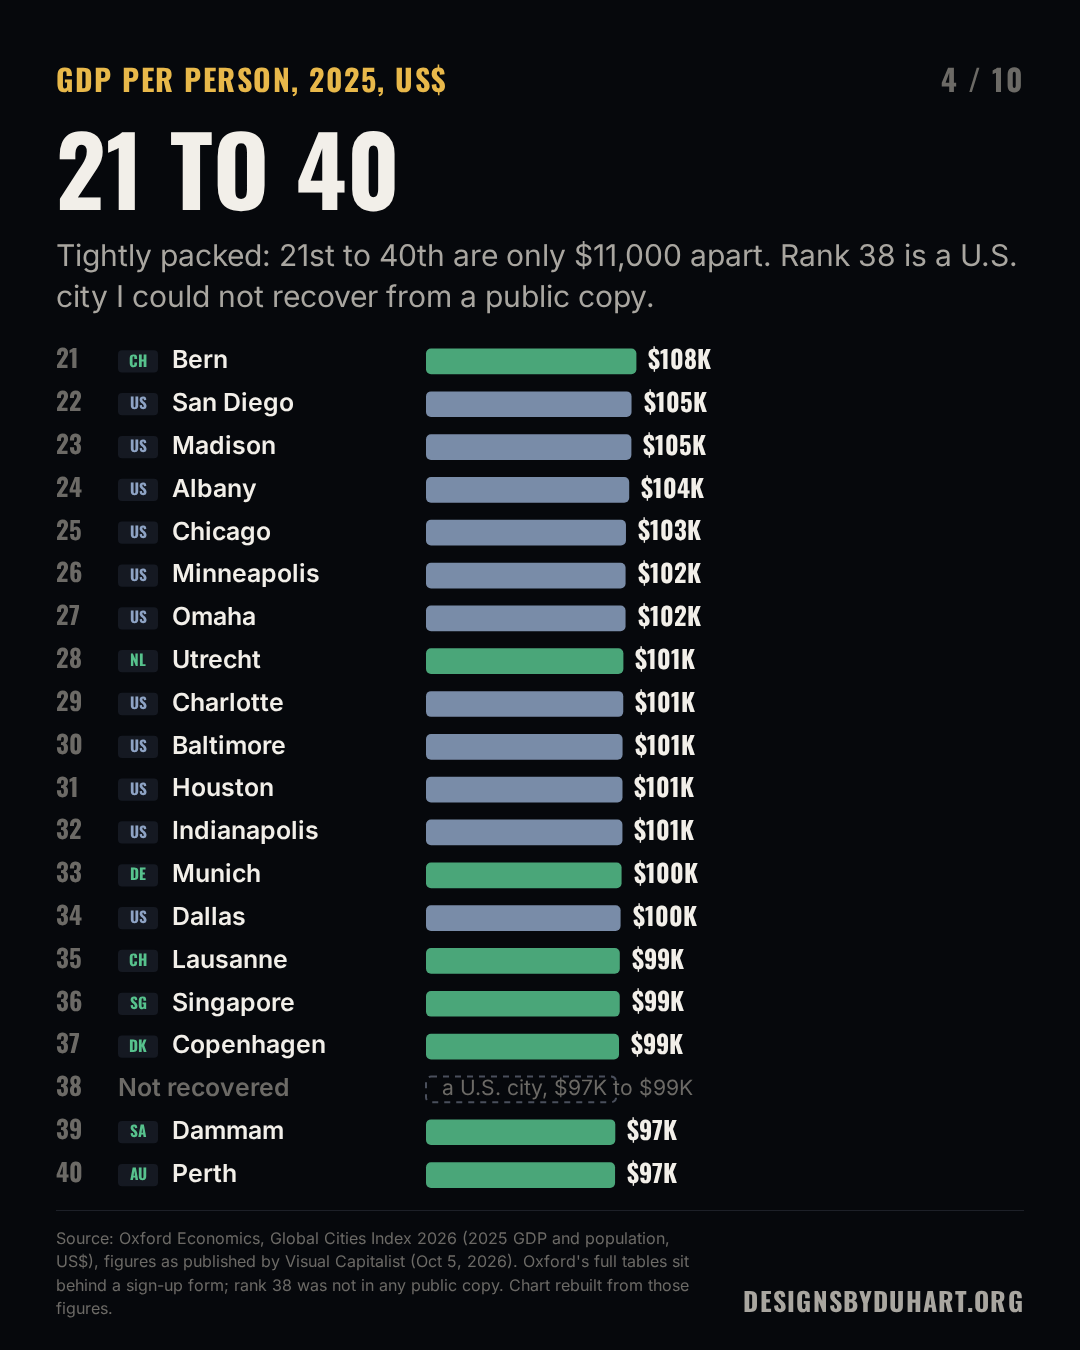
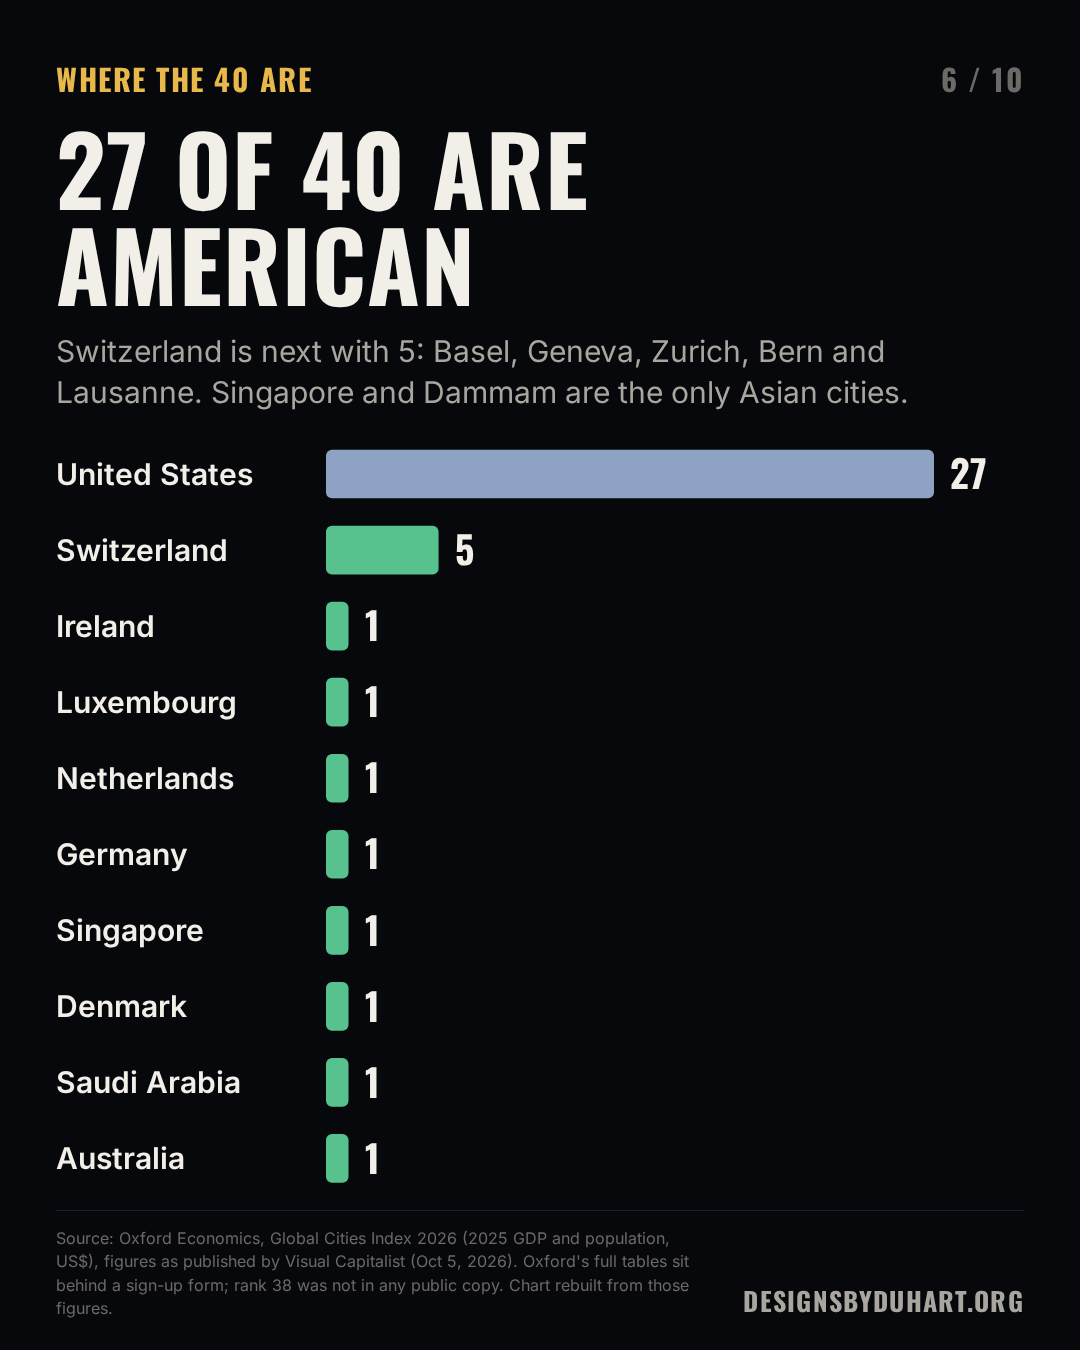
27 of 40
The U.S. has 27 of the 40 cities, which matches Visual Capitalist's count. Switzerland has 5. The only Asian cities are Singapore (36th) and Dammam in Saudi Arabia (39th).
One small mismatch I found: Oxford's U.S. briefing says U.S. cities hold 16 of the top 20 places for GDP per person, and it names Dublin, Basel, Luxembourg and Zurich as the exceptions. The published table has 15, because Geneva is 7th. I can't tell from the outside which is right, and it doesn't change the story, but it's the kind of thing I'd flag before anyone quoted the number.
Where the 40 are
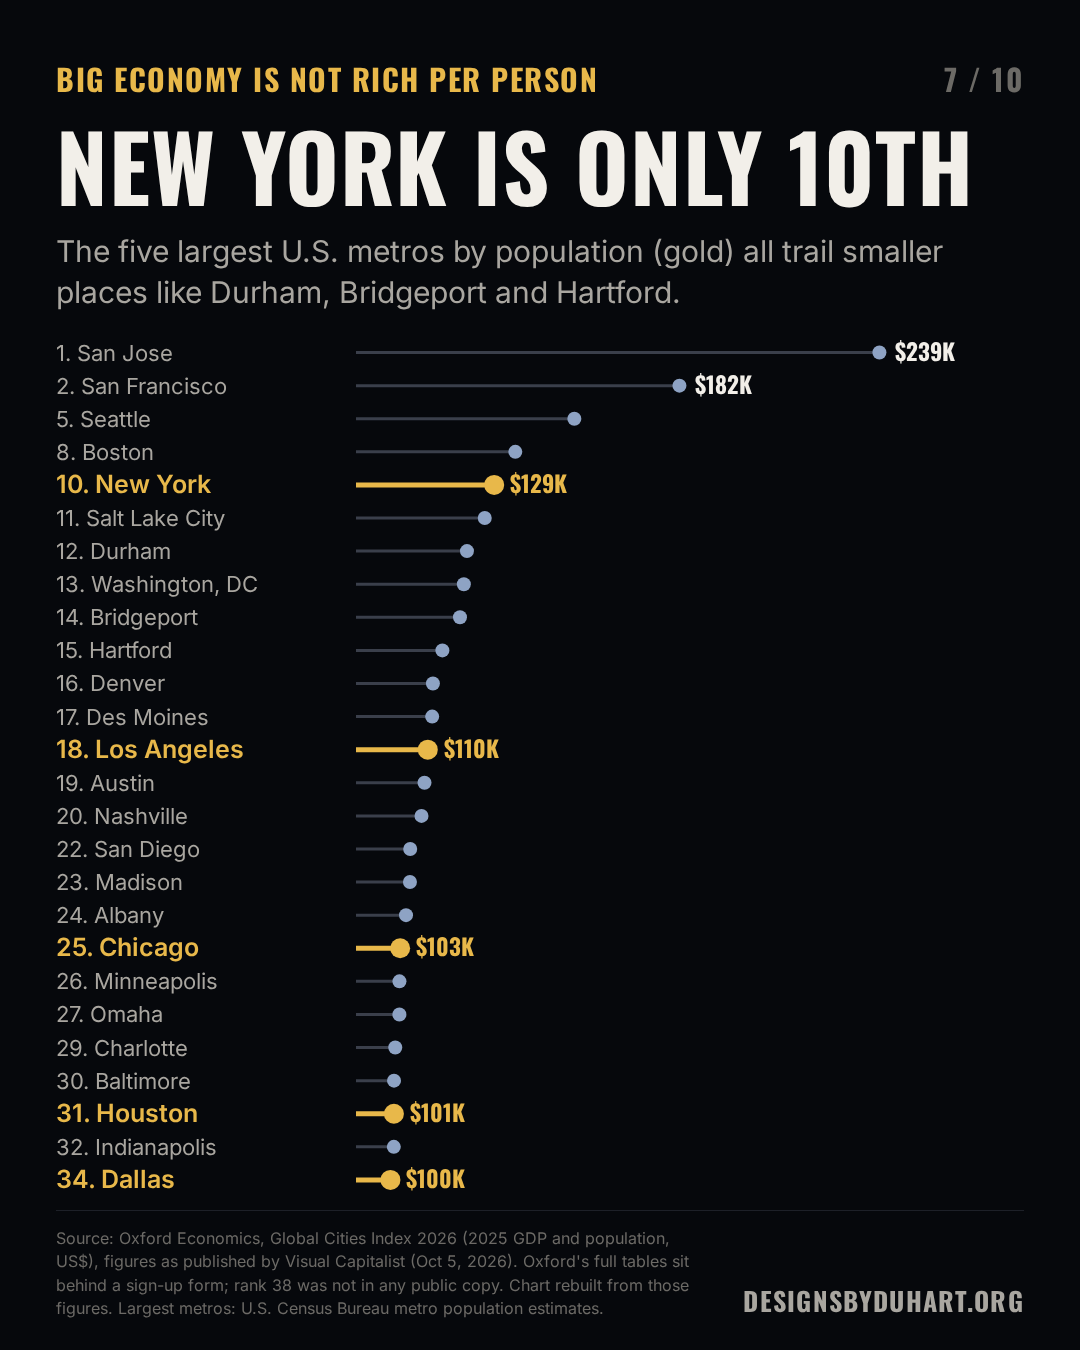
Big is not the same as rich per person
New York is the biggest city economy in the world by Oxford's measure, and it's 10th here. Los Angeles is 18th, Chicago 25th, Houston 31st, Dallas 34th. Meanwhile Durham, Bridgeport, Hartford and Des Moines all rank above Los Angeles.
The largest U.S. metros against the rest
This is where per person numbers for cities get slippery. GDP is counted where the work happens. Population is counted where people sleep. A metro that draws in commuters from outside its boundary gets their output in the numerator and none of them in the denominator. Small metros with one dominant high-value industry also jump up the list: Bridgeport's metro is Fairfield County, home to the hedge funds of Stamford and Greenwich, and Hartford is an insurance capital. A city figure can't tell you whether the typical resident shares in that output.
Outside the U.S.
The 13 cities outside the U.S.
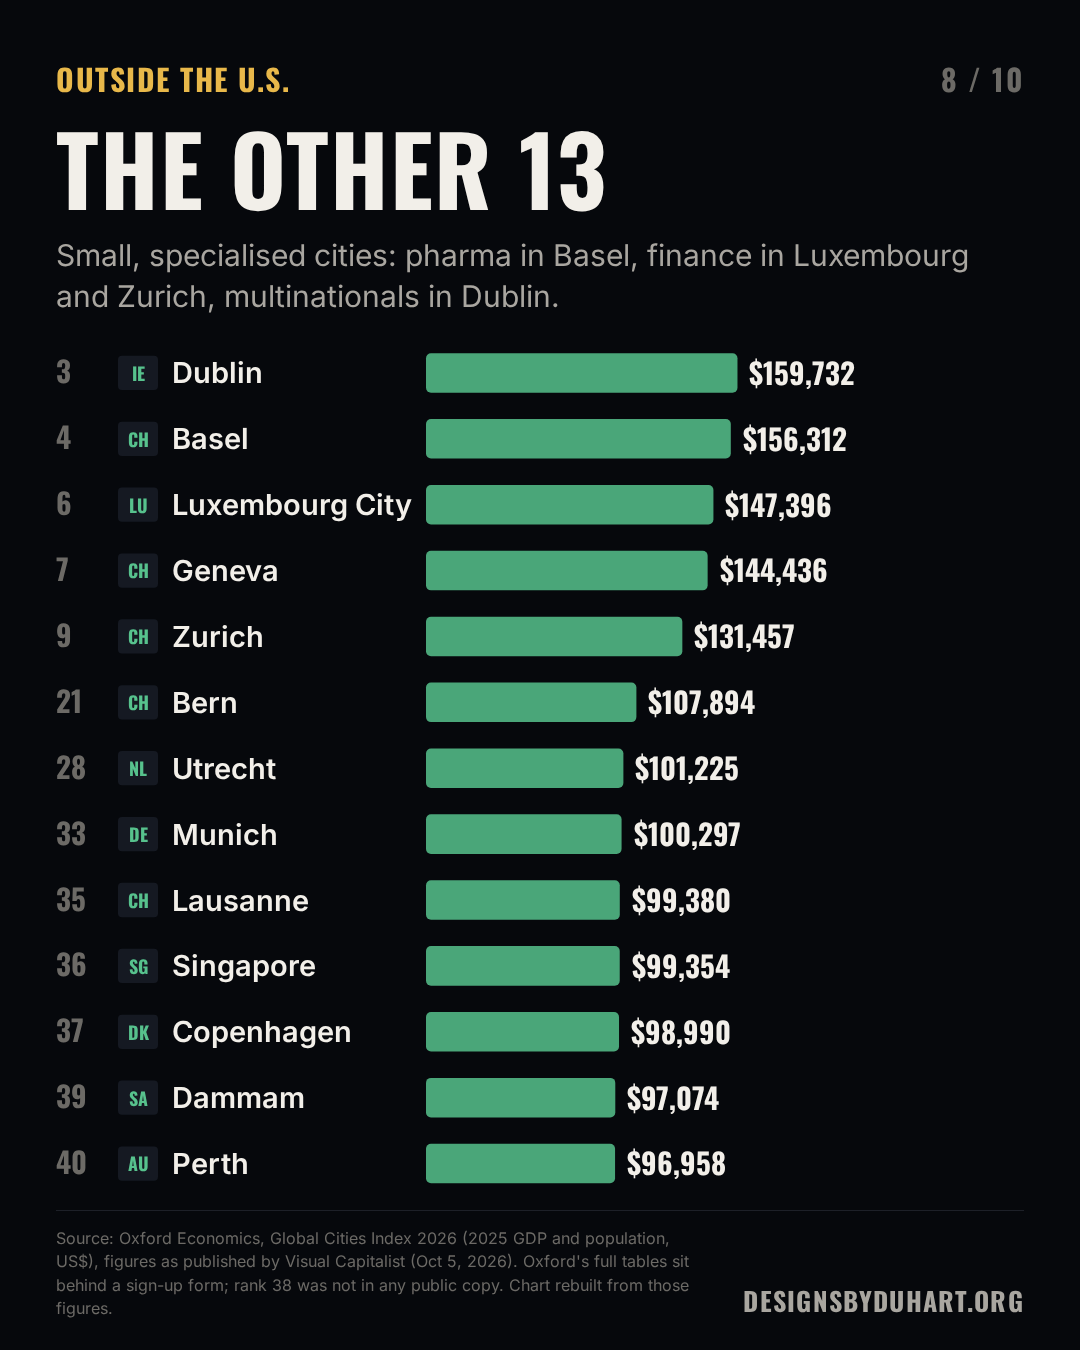
The non-U.S. list is small, specialised cities: pharma in Basel, finance in Luxembourg and Zurich, multinationals booking profits in Dublin. Oxford itself notes that Dublin's GDP is unusually sensitive to multinational activity. Dammam in Saudi Arabia is the oil example, and Perth closes the list at 40th.
Data transparency
The owner's brief for this post was cut off, so these notes are derived from the same Oxford Economics source used for the city economies post, with the per person caveats added.
- Source: Oxford Economics, Global Cities Index 2026, city GDP and population for 2025 in U.S. dollars. City values as published by Visual Capitalist and reprinted by Business Today. Oxford's public briefings: top U.S. cities and top 10 by economic strength.
- Strengths: a reputable forecaster with consistent metro definitions across 1,000 cities. Per person puts small, productive metros next to giants.
- Weaknesses: commuters inflate GDP per resident. Metro boundaries drive city GDP. Nominal U.S. dollars move with exchange rates. The data is proprietary, the report sits behind a form, and rank 38 is not in any public copy I could read.
- Data quality: medium-low. Credible source, but not reproducible from public data, and read here through a secondary table.
How I built it
I saved Oxford's public pages and chart images, transcribed the 40 rows into a CSV with a provenance code on each one, and wrote a script that checks the order, the 27 of 40 count, San Jose's lead, and the top 20 count against Oxford's text. It prints Oxford's statements straight from the saved pages so I'm not quoting from memory. Rank 38 is an empty row in the CSV, and it stays empty on the chart.
Sources
- Oxford Economics, Global Cities Index 2026; The top US cities in 2026 (September 28, 2026); The world's top 10 cities by economic strength in 2026 (September 17, 2026).
- Original post: Ranked: The World's 40 Richest Cities by GDP Per Person (Visual Capitalist, October 5, 2026). I rebuilt the chart from the published figures; none of the original graphics or text are reused.
- Reprint used to confirm values: Business Today, October 6, 2026.
More Ranked & Mapped soon: one chart, one source, and the caveats that come with it.
More: LinkedIn · Instagram. Portfolio and case studies: designsbyduhart.org.
If any of this saved you an afternoon, Buy me a coffee.