Ranked: The World's Most and Least Taxed Countries
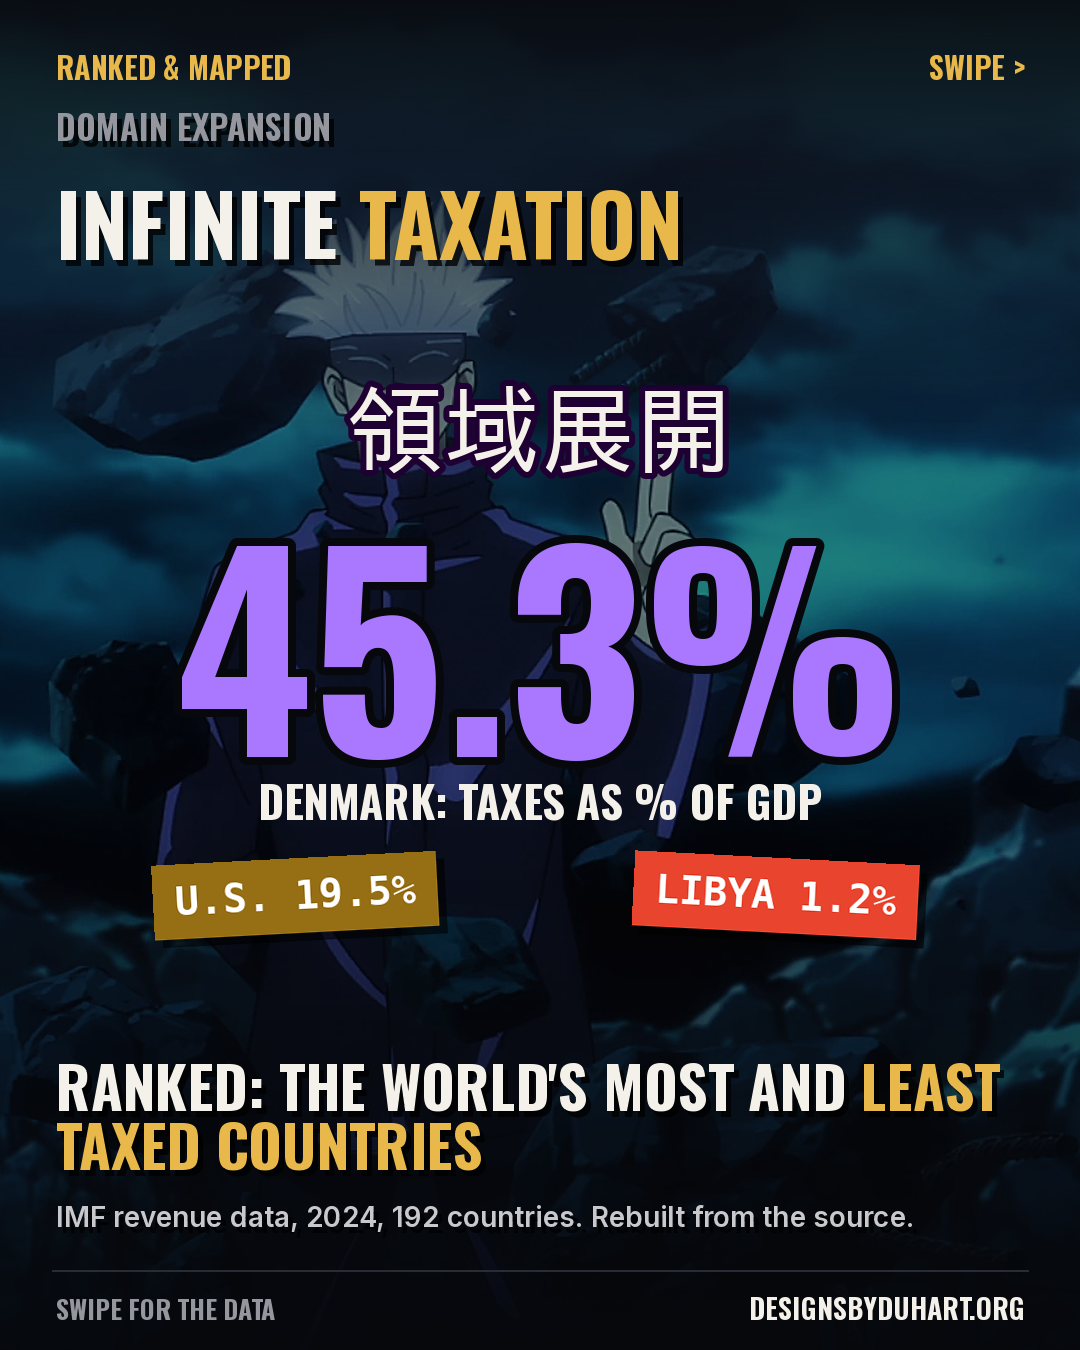
Denmark collects taxes worth 45.3% of its GDP, more than double the U.S. at 19.5%. I rebuilt the ranking from the IMF's revenue database, then checked the country in second place. It didn't hold up.
The domain of Infinite Taxation
Denmark collects taxes worth 45.3% of its GDP. The U.S. collects 19.5%. At the other end, Libya, Kuwait and Iraq each collect less than 2%.
Visual Capitalist ranked the world's most and least taxed countries on October 1 (original post) using the IMF's World Revenue Longitudinal Database, WoRLD for short. I rebuilt it from the source. The IMF publishes WoRLD through an SDMX API, so I pulled every country from 2020 on, kept the raw file, and wrote a derive script that pulls out 2024 taxes as a share of GDP.
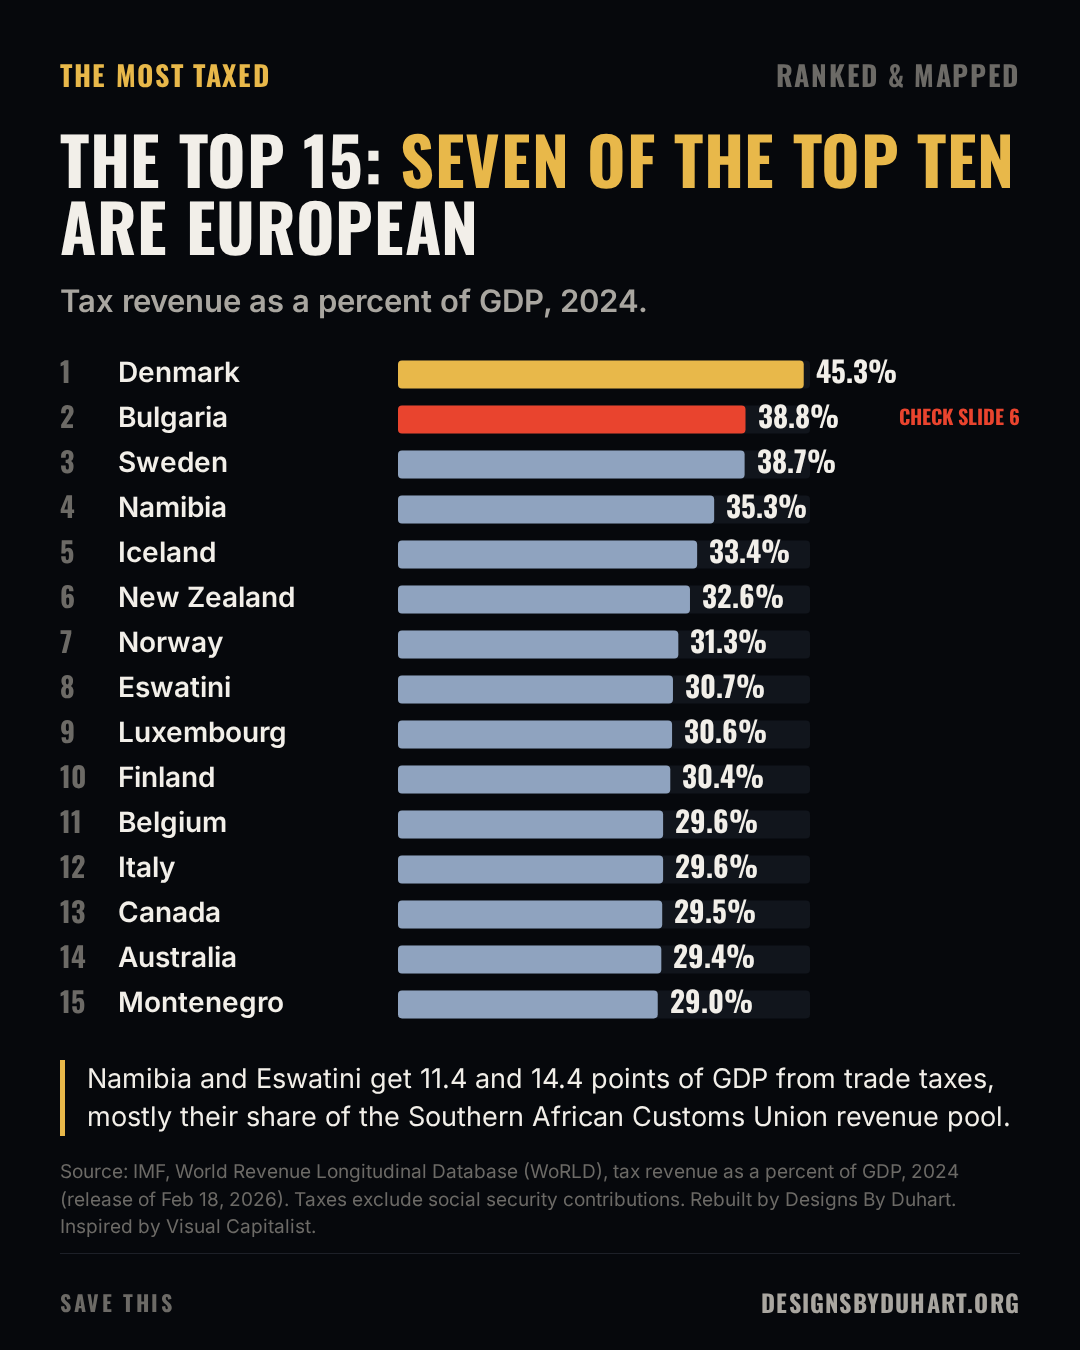
The headline numbers match: Denmark 45.3%, the U.S. 19.5%, and seven of the top ten are European. Then I looked hard at the country in second place, and that's where this post gets interesting.
Domain expansion: Infinite Taxation
The 38 second anime version

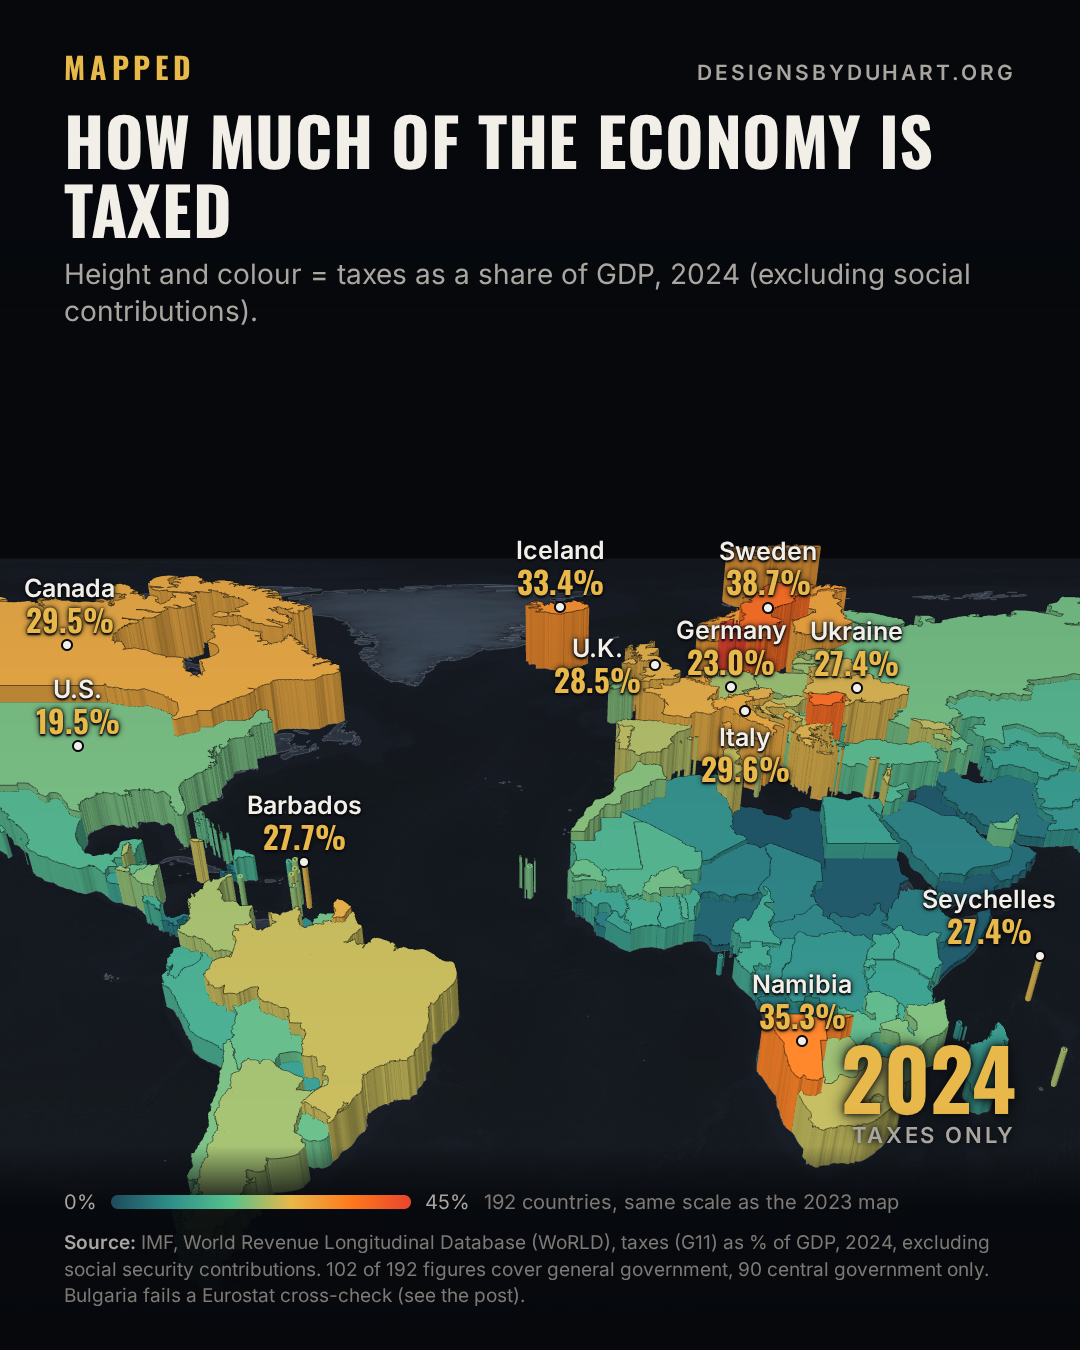
The whole world, extruded
Explore it in 3D
The most taxed
The metric is tax revenue divided by GDP. In the IMF's definitions that's GFS code G11: income taxes, taxes on goods and services, property taxes, trade taxes. It does not include social security contributions, and that one choice matters a lot, which I'll come back to.
Denmark leads by a wide margin. The Nordics are all near the top. Two southern African countries, Namibia and Eswatini, show up in the top ten, and the data shows why: taxes on international trade alone are worth 11.4% of GDP in Namibia and 14.4% in Eswatini, mostly their share of the Southern African Customs Union revenue pool.
The top 15
The least taxed
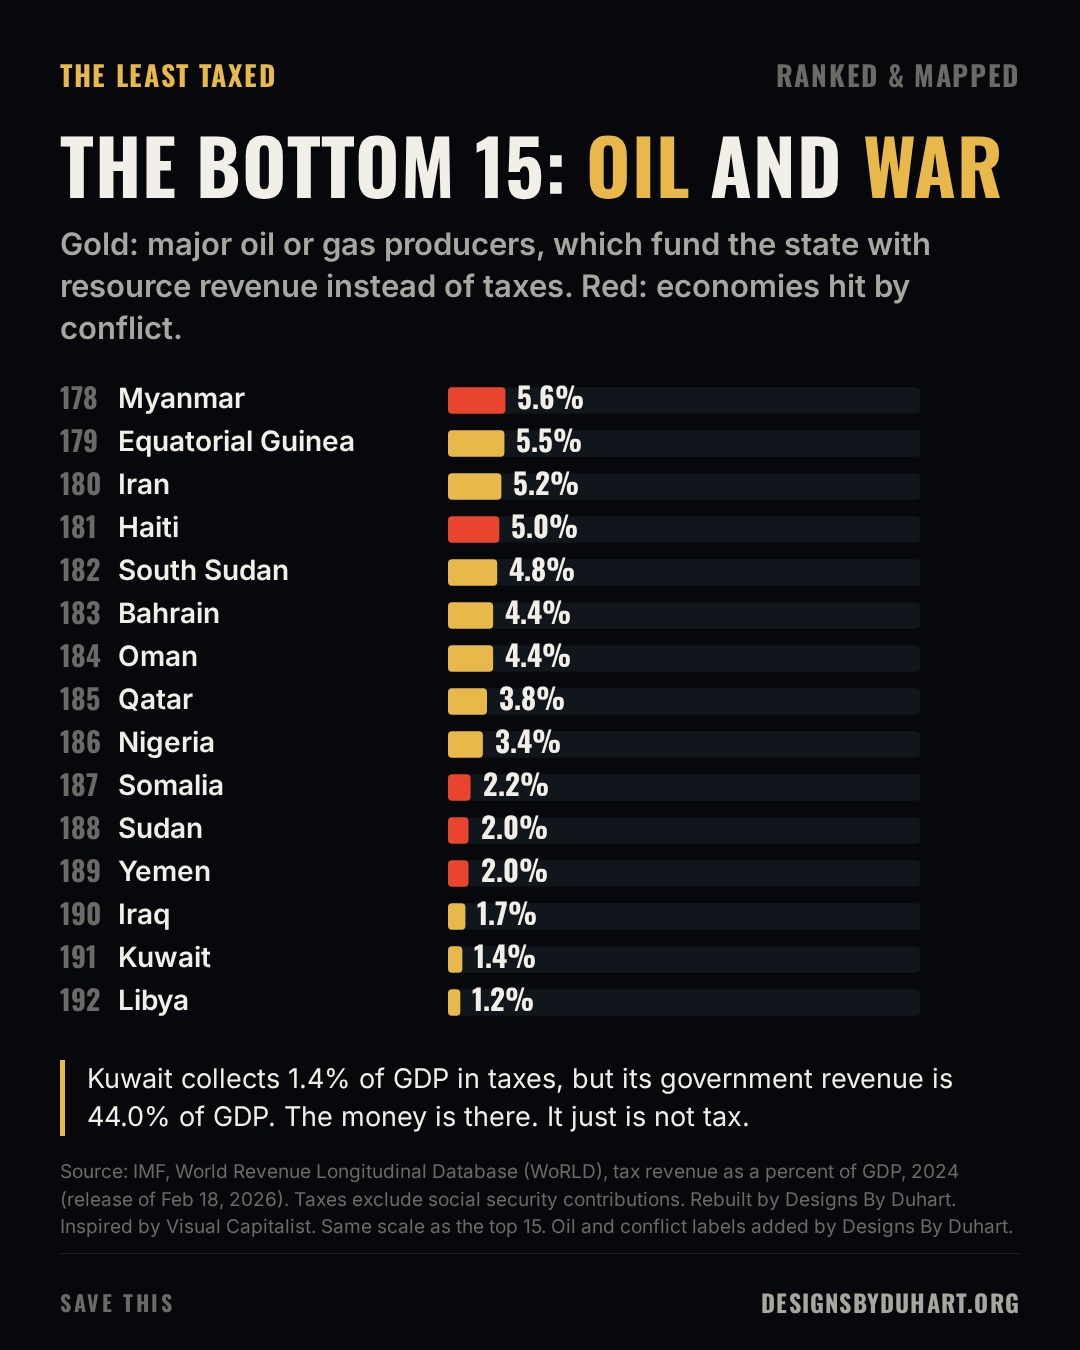
The bottom of the table is mostly oil and gas producers and countries in or coming out of war. Oil states don't need much tax. Kuwait collects 1.4% of GDP in taxes, but its total government revenue is 44% of GDP, because the state owns the oil. Calling Kuwait "least taxed" is technically right and practically misleading: the government still takes a big share of the economy, just not through a tax bill.
The bottom 15
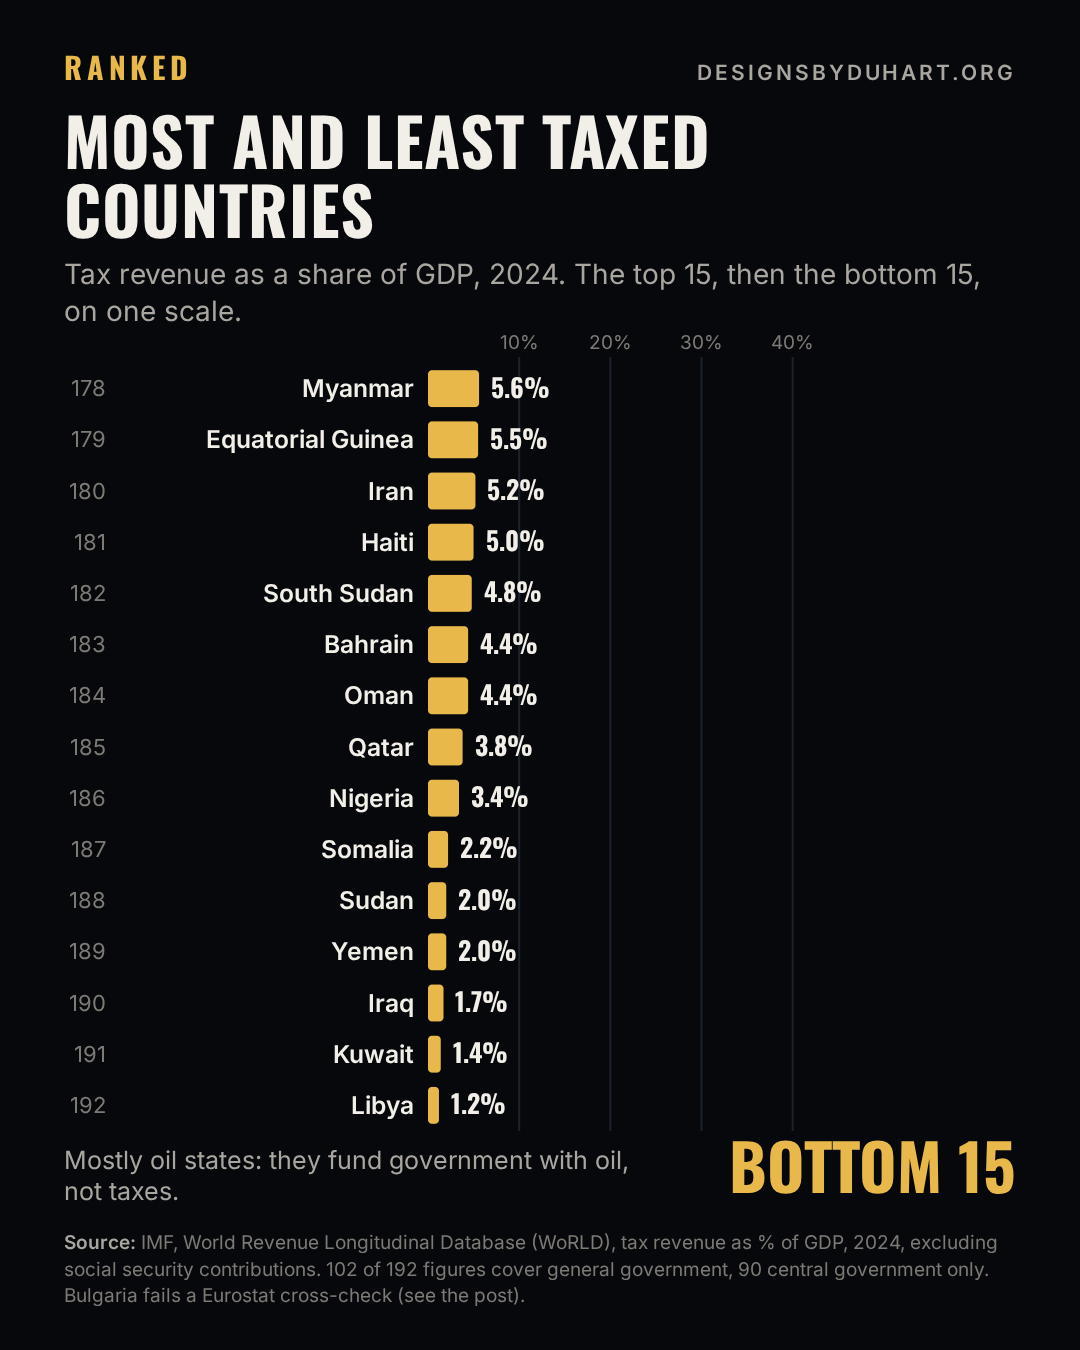
Top and bottom, on one scale
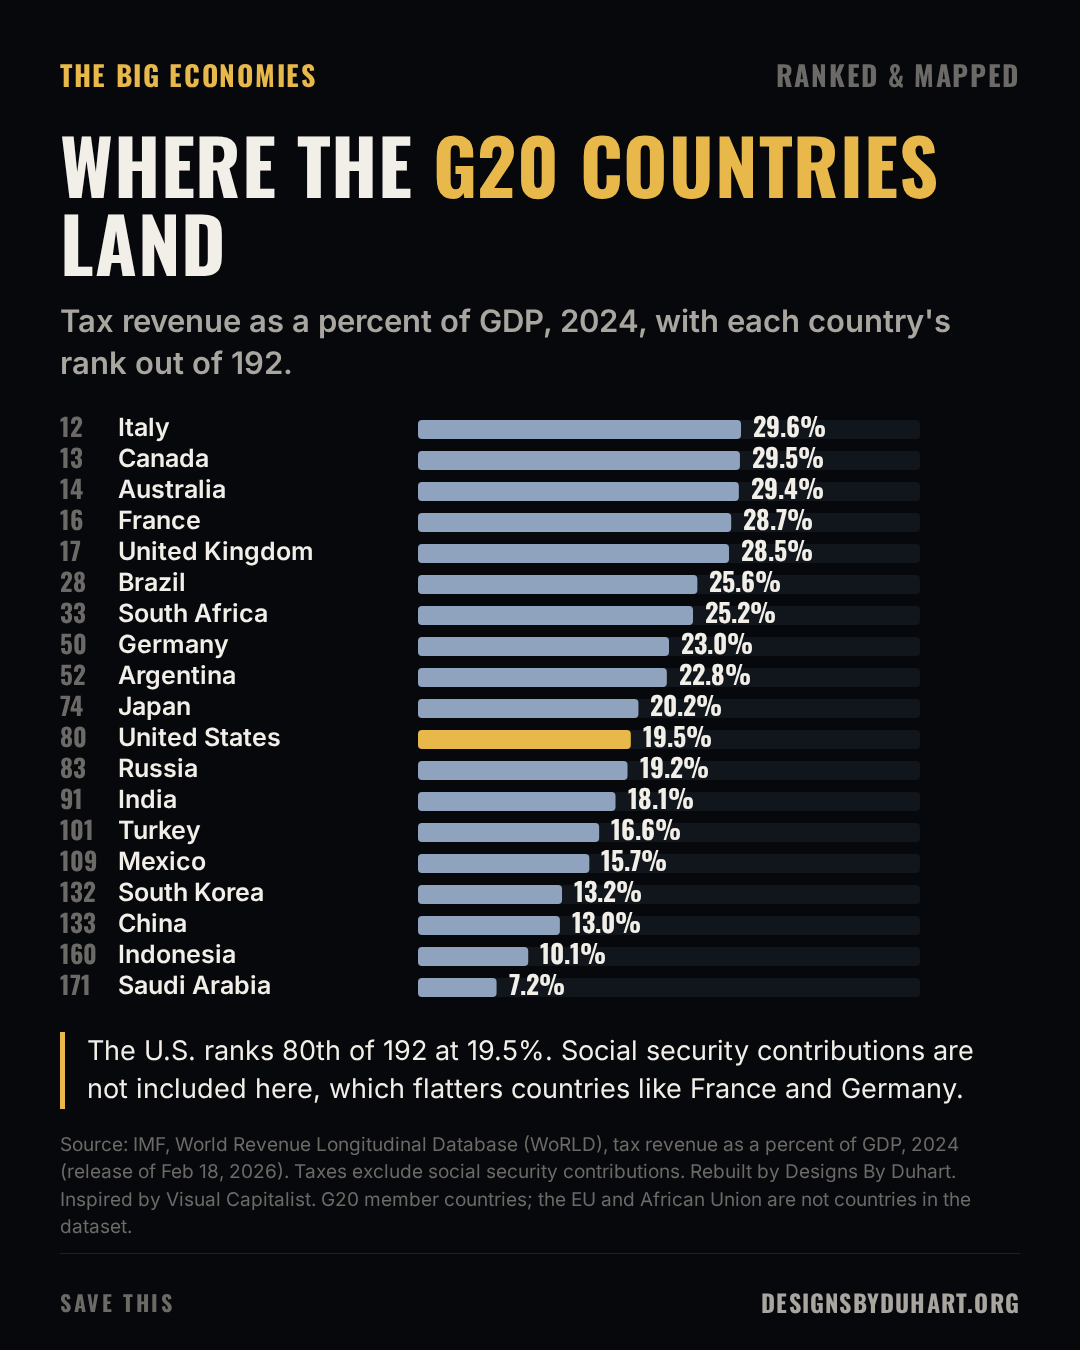
Where the G20 lands
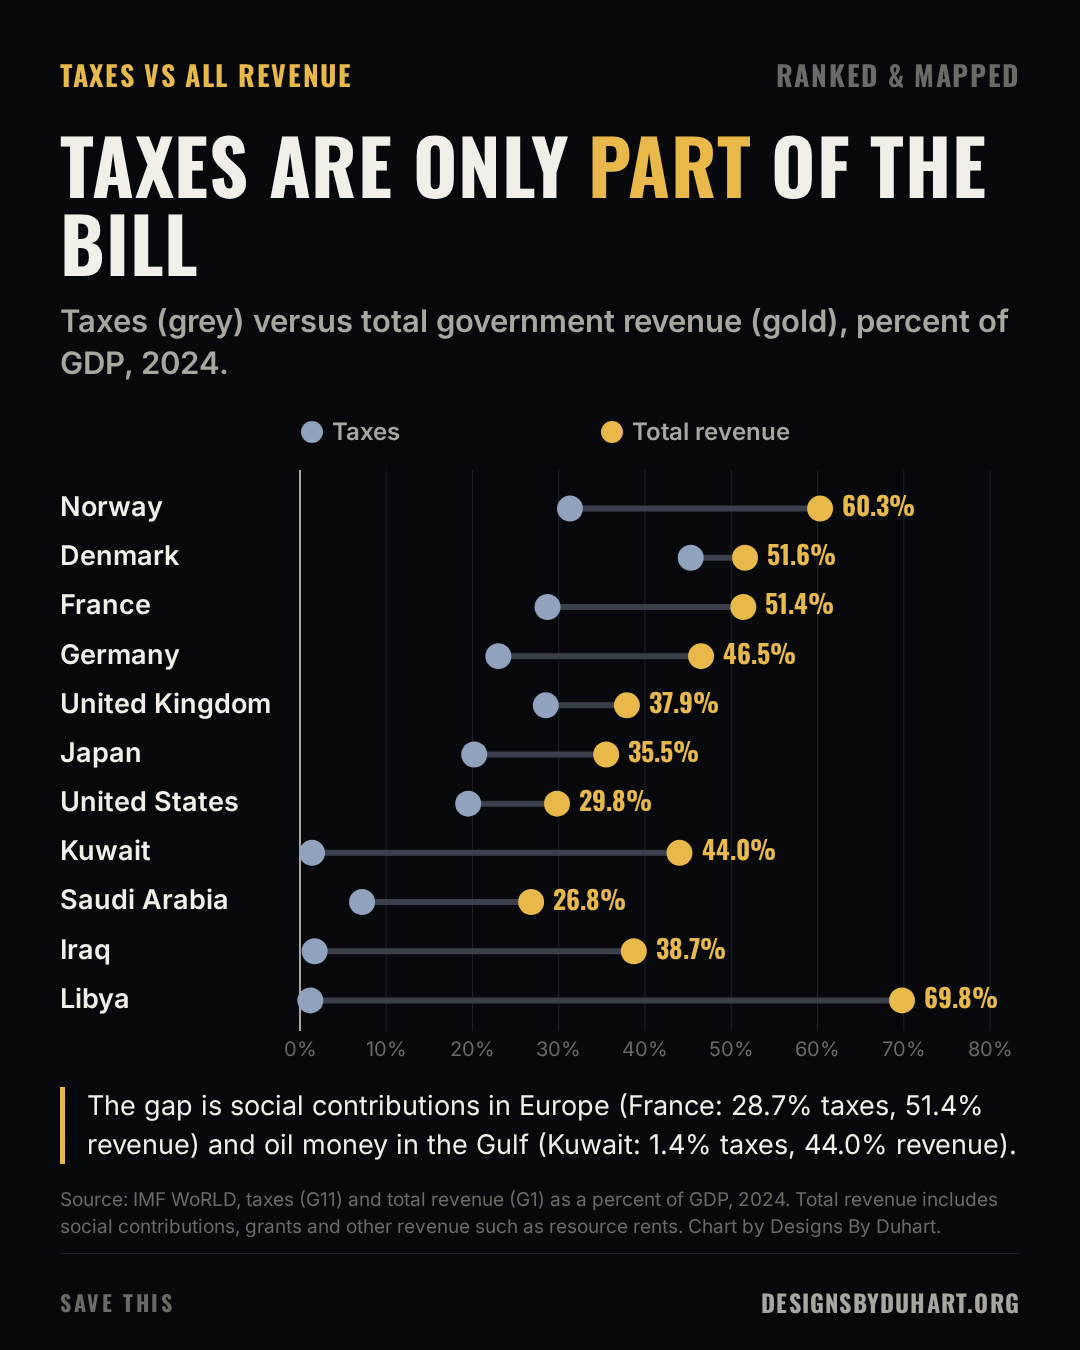
Taxes are only part of the bill
Here's the social contributions problem. In France, Germany and much of Europe, pensions and health care are funded by contributions taken from payroll. They're compulsory and they come out of the same paycheck, but they aren't counted as taxes in G11. So France shows 28.7% in taxes but 51.4% in total government revenue. Germany shows 23.0% in taxes and 46.5% in total revenue.
Total revenue isn't a perfect "burden" number either, because it also includes oil money and grants. But putting the two side by side tells you much more than either one alone.
Taxes vs total revenue
Explore all 192 countries
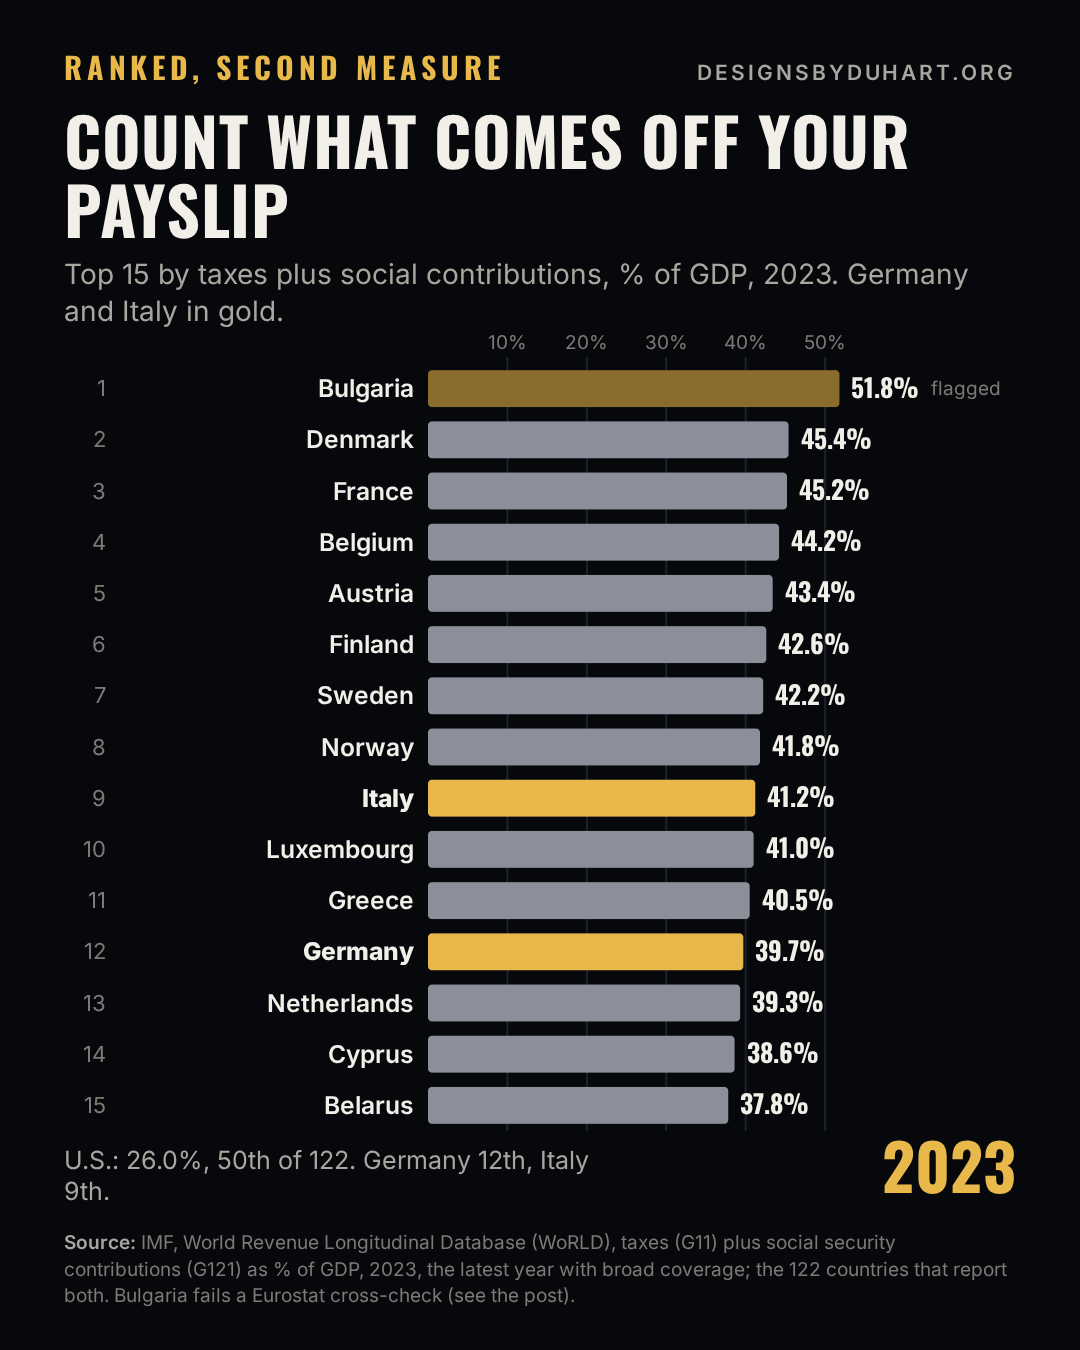
Count what comes off your payslip
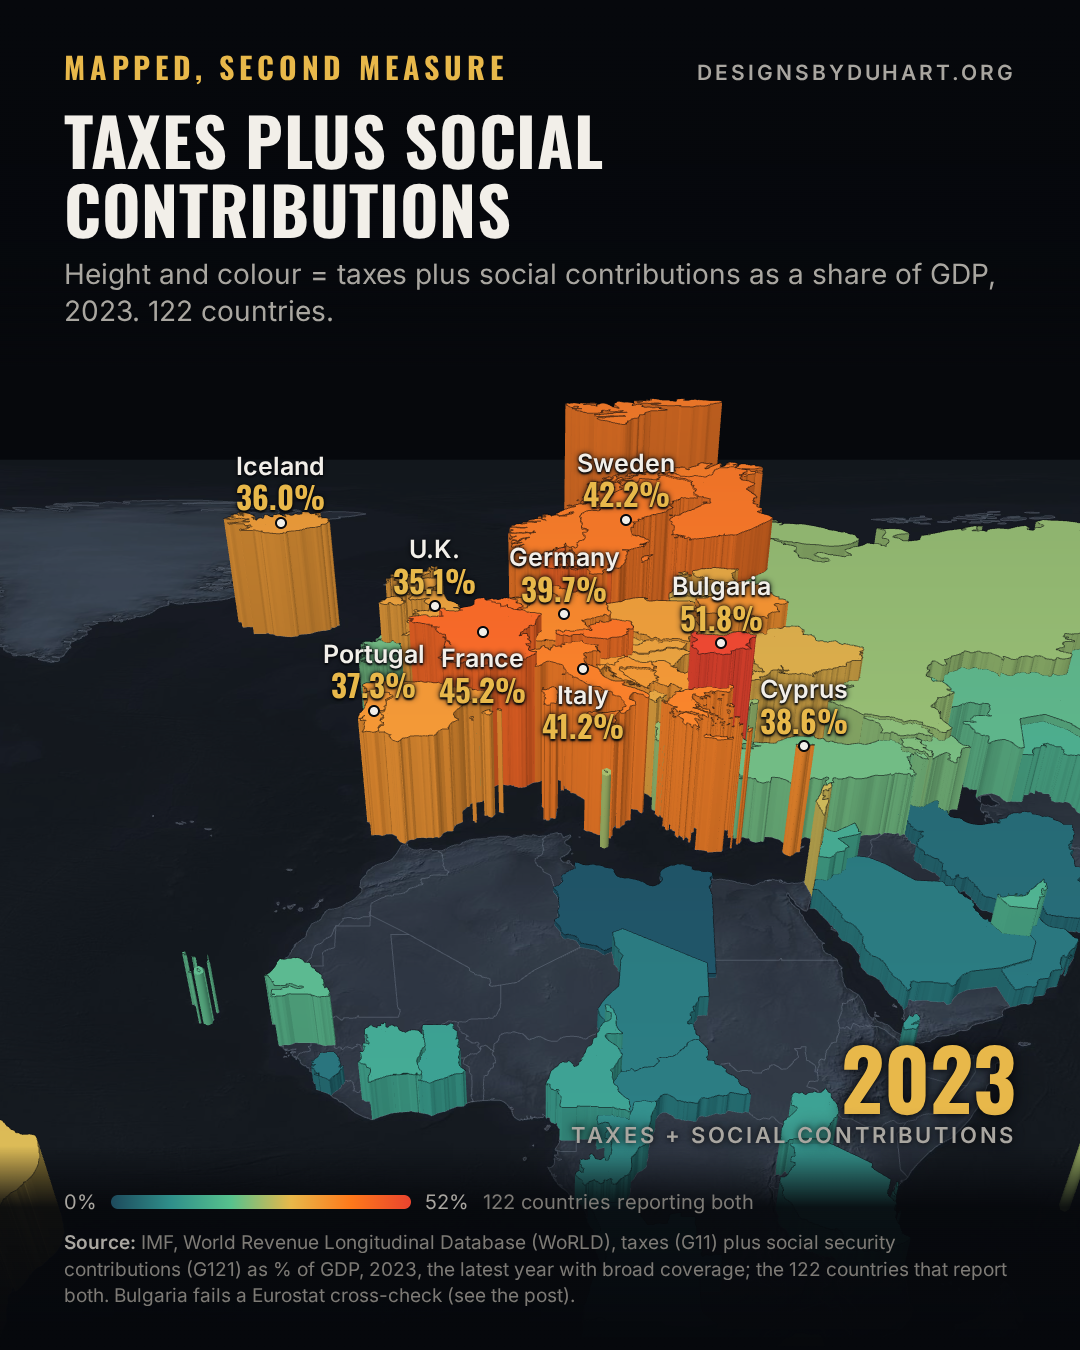
The ranking above counts taxes only. Add social security contributions, the pension and health money taken straight off a payslip, and the order changes: France, Austria and Belgium jump into the top five, Italy is 9th at 41.2% and Germany 12th at 39.7%. The U.S. lands 50th of 122 at 26.0%. This second ranking uses 2023, the latest year the IMF has social contributions for most countries.
Taxes plus social contributions, 2023
The second measure, in 3D
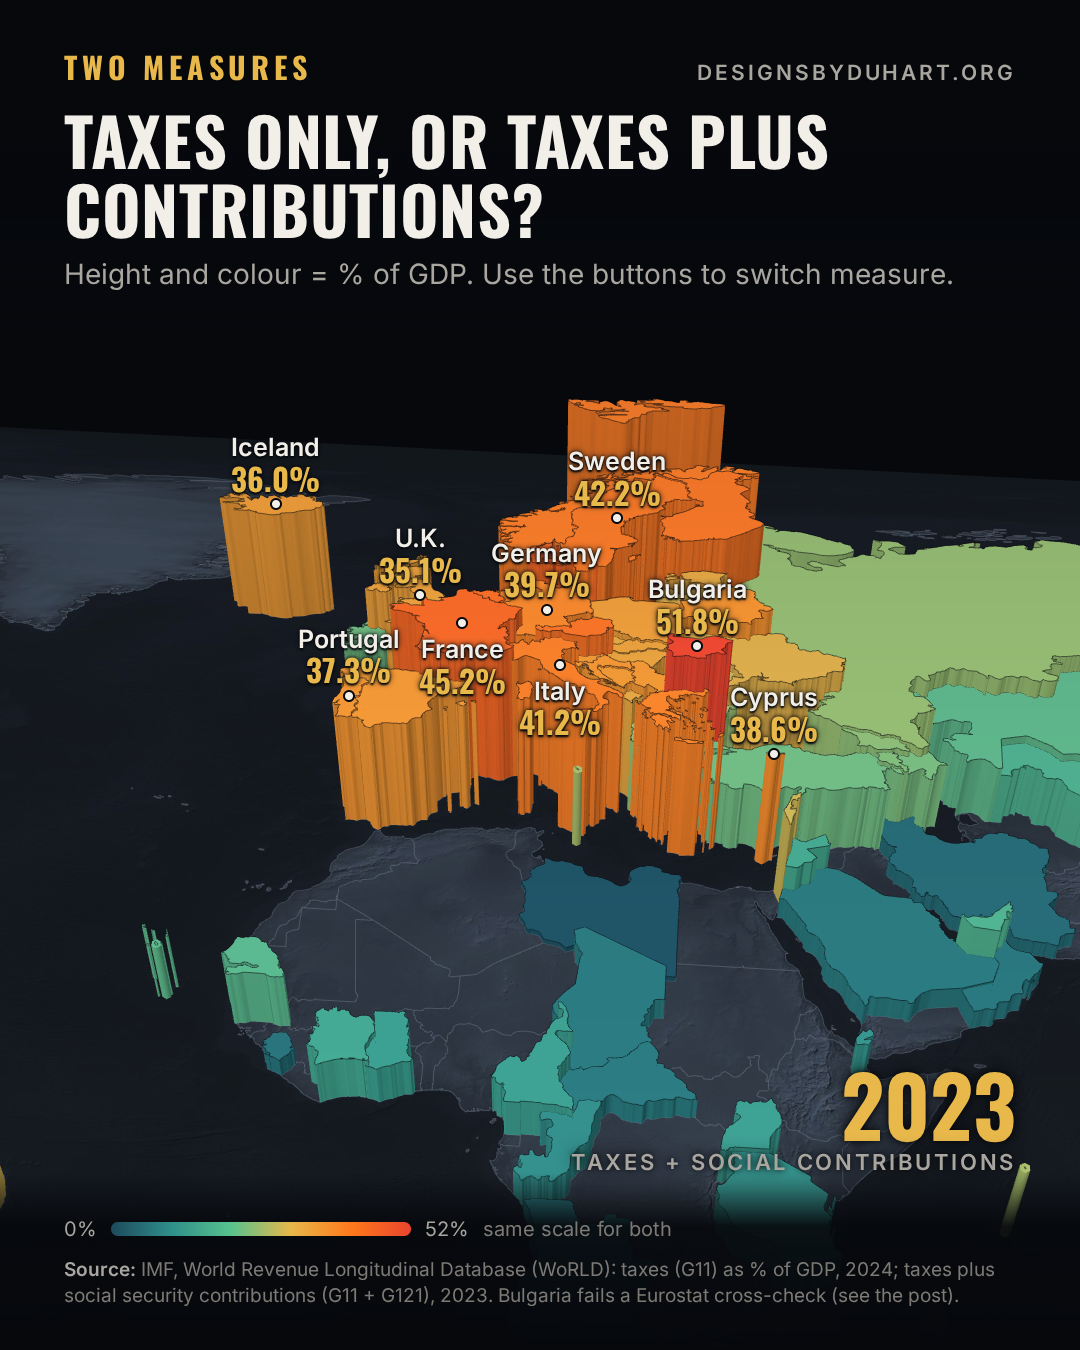
Switch between the two measures
I checked number two. It doesn't hold up.
Bulgaria in second place, ahead of Sweden, didn't feel right to me. Bulgaria is known for a flat 10% income tax and one of the lower tax takes in the EU. In WoRLD, Bulgaria's taxes come to 38.8% of GDP and its total government revenue to 65.1% of GDP. A government that big would be the largest in Europe by a wide margin.
So I pulled a second source. Eurostat publishes general government accounts for every EU country. For 2024 it puts Bulgaria's total revenue at 36.1% of GDP, and its two main tax categories (taxes on production and imports, plus current taxes on income and wealth) at 21.1%. Before trusting that, I ran the same comparison for Denmark: Eurostat's total revenue is 51.6%, exactly what WoRLD shows, and its main taxes come to 44.8% against WoRLD's 45.3%. The method lines up for Denmark and breaks for Bulgaria by roughly 1.8 times.
My read: Bulgaria's WoRLD row is probably inflated, maybe a units or GDP denominator problem somewhere upstream. I can't prove where it went wrong from the outside, so I left Bulgaria in the ranking exactly as the IMF publishes it and flagged it everywhere it appears. On Eurostat's numbers it would fall to roughly 68th of 192. Visual Capitalist's chart repeats the 38.8% at number two.
The cross-check
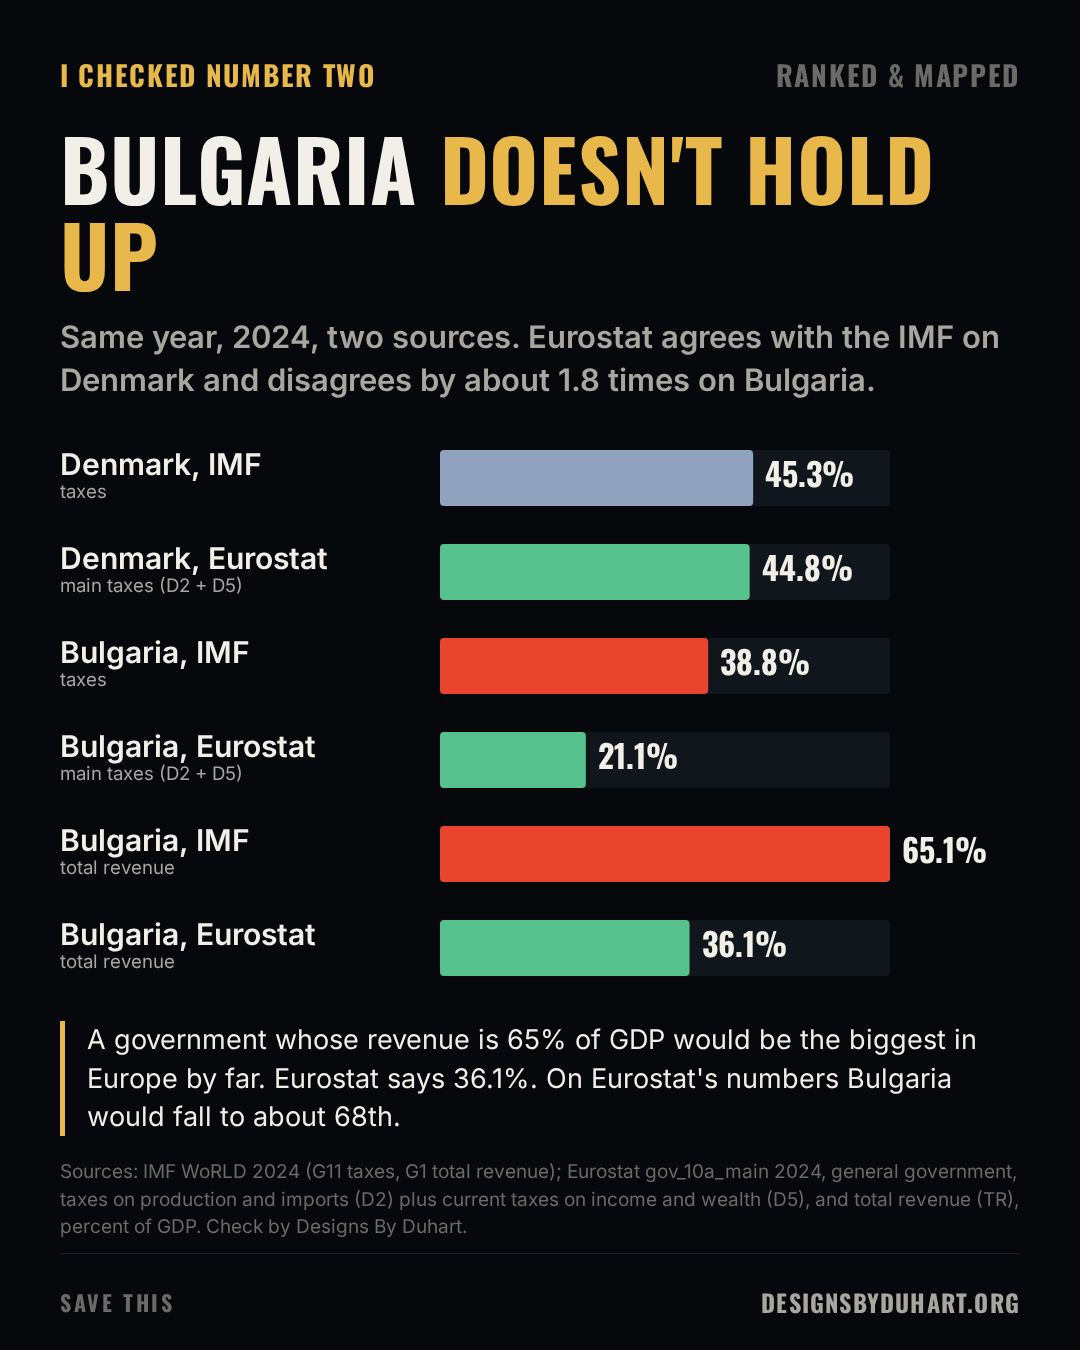
Silently fixing a source is worse than labeling it. Leave the number, flag it, and show the check.
How I handle a row that fails a cross-check
The whole world at once
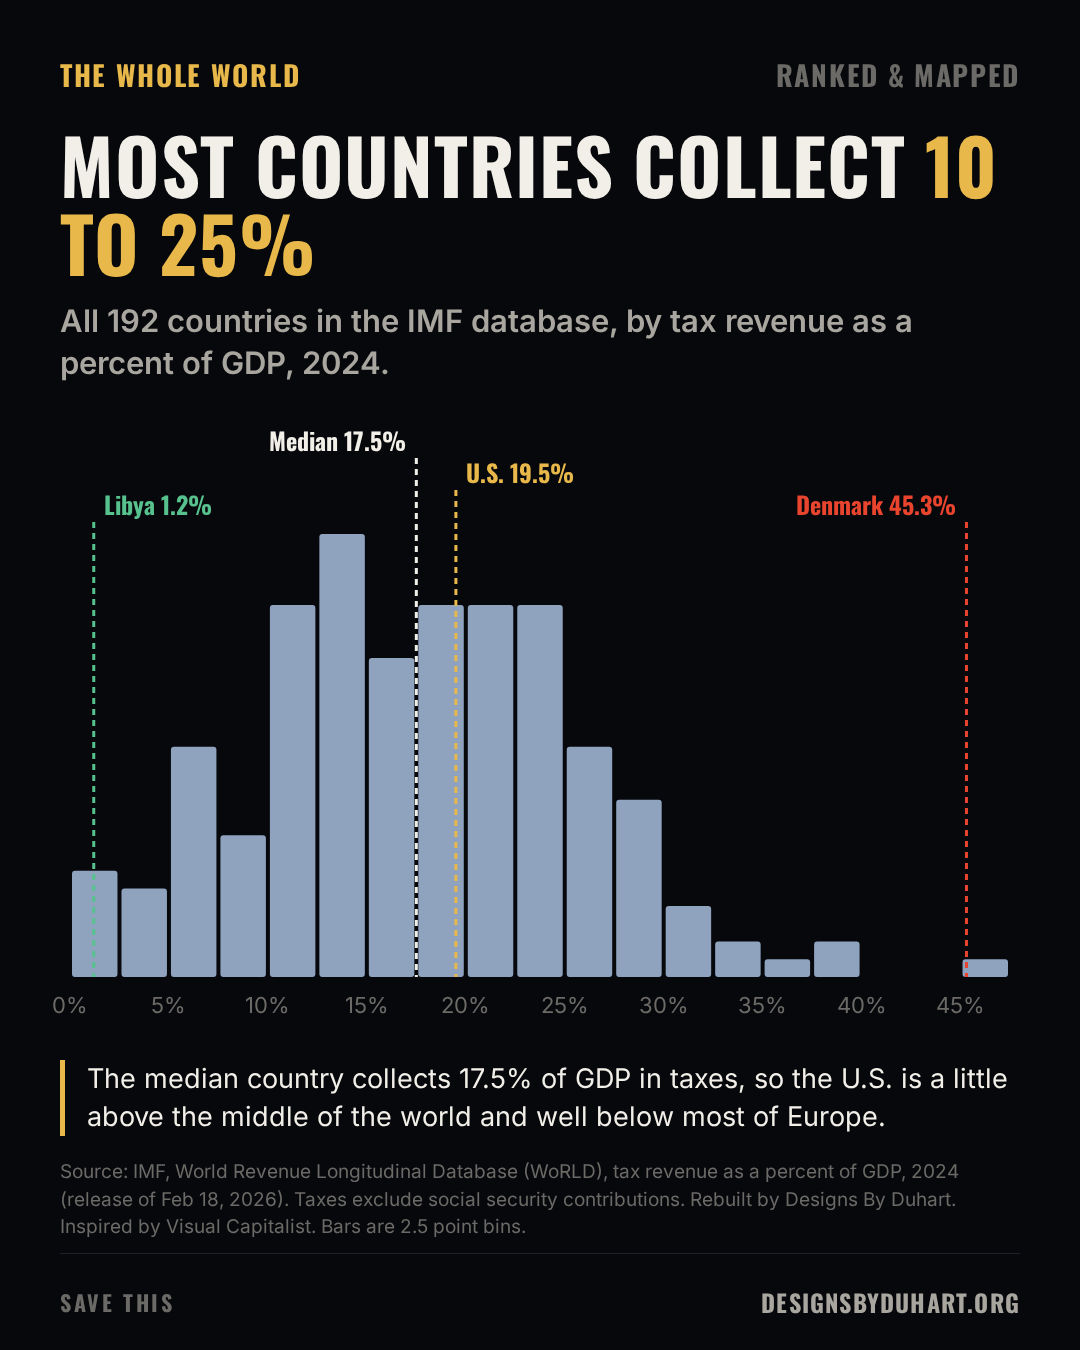
Zoom out to all 192 countries and the picture is calmer than the extremes. The median country collects 17.5% of GDP in taxes. Most fall somewhere between 10% and 25%. The U.S. at 19.5% is a little above the global middle and well below most of Europe.
The distribution
Data Transparency
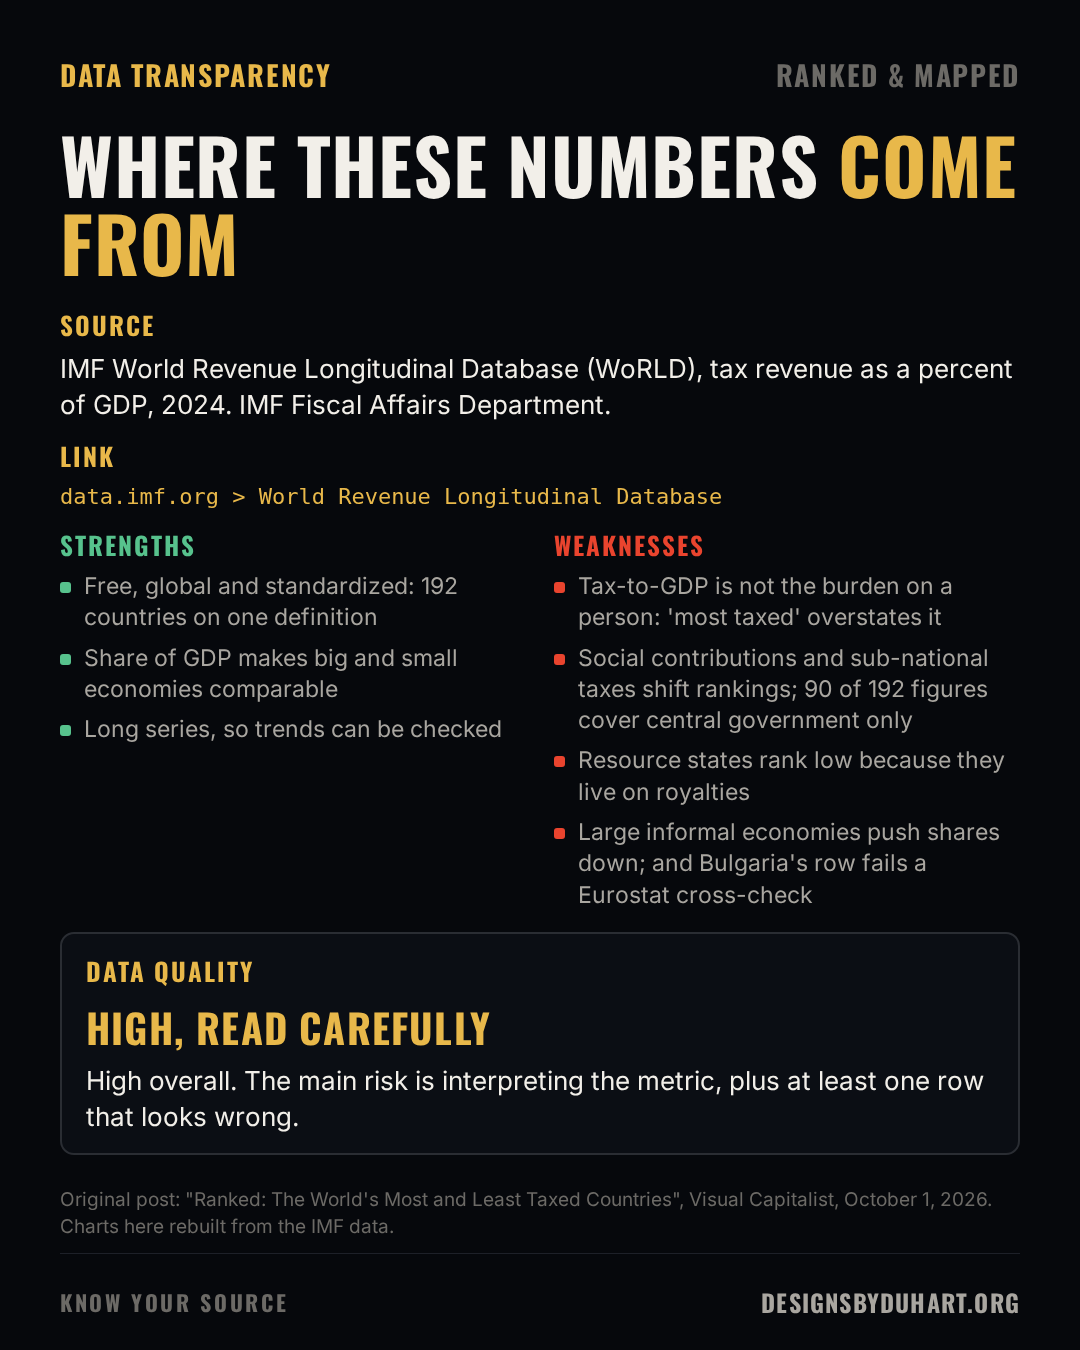
- Source: IMF World Revenue Longitudinal Database (WoRLD), tax revenue as a percent of GDP, 2024 (IMF Fiscal Affairs Department; release dated February 18, 2026). Pulled from the IMF SDMX API on October 8, 2026.
- Strengths: free, global and standardized, with 192 countries on one definition; a share of GDP makes big and small economies comparable; a long series, so trends can be checked.
- Weaknesses: tax-to-GDP is not the tax burden on an individual, so "most taxed" overstates what it measures; social contributions and sub-national taxes shift rankings, and 90 of the 192 figures cover central government only; resource states rank low because they rely on royalties; large informal economies push measured shares down. And at least one row, Bulgaria, fails an independent cross-check.
- Data quality: high overall. The main risk is interpreting the metric, plus rows that nobody re-checks.
Data Transparency
Why this matters for a data engineer
Rankings across 190-plus countries have a predictable failure: one bad feed lands at the top, and the top is the part everybody screenshots. Any market-level leaderboard has the same risk. The fix isn't fancy. Before publishing, look at the outliers, find an independent source for each one, and if they disagree, say so on the chart.
Sources
- IMF, World Revenue Longitudinal Database (WoRLD), taxes (G11) and total revenue (G1) as a percent of GDP, 2024, via the IMF SDMX API
- Eurostat, Government revenue, expenditure and main aggregates (gov_10a_main), 2024, for the Bulgaria and Denmark cross-check
- Original post: Ranked: The World's Most and Least Taxed Countries (Visual Capitalist, October 1, 2026). Every chart here was rebuilt from the IMF data.
Next in Ranked & Mapped: the world's strongest city economies by 2050, and how much of it is forecast rather than data.
More: LinkedIn · Instagram. Portfolio and case studies: designsbyduhart.org.
If any of this saved you an afternoon, Buy me a coffee.