Honey, I Shrunk the Dollar: what happened in 1971?
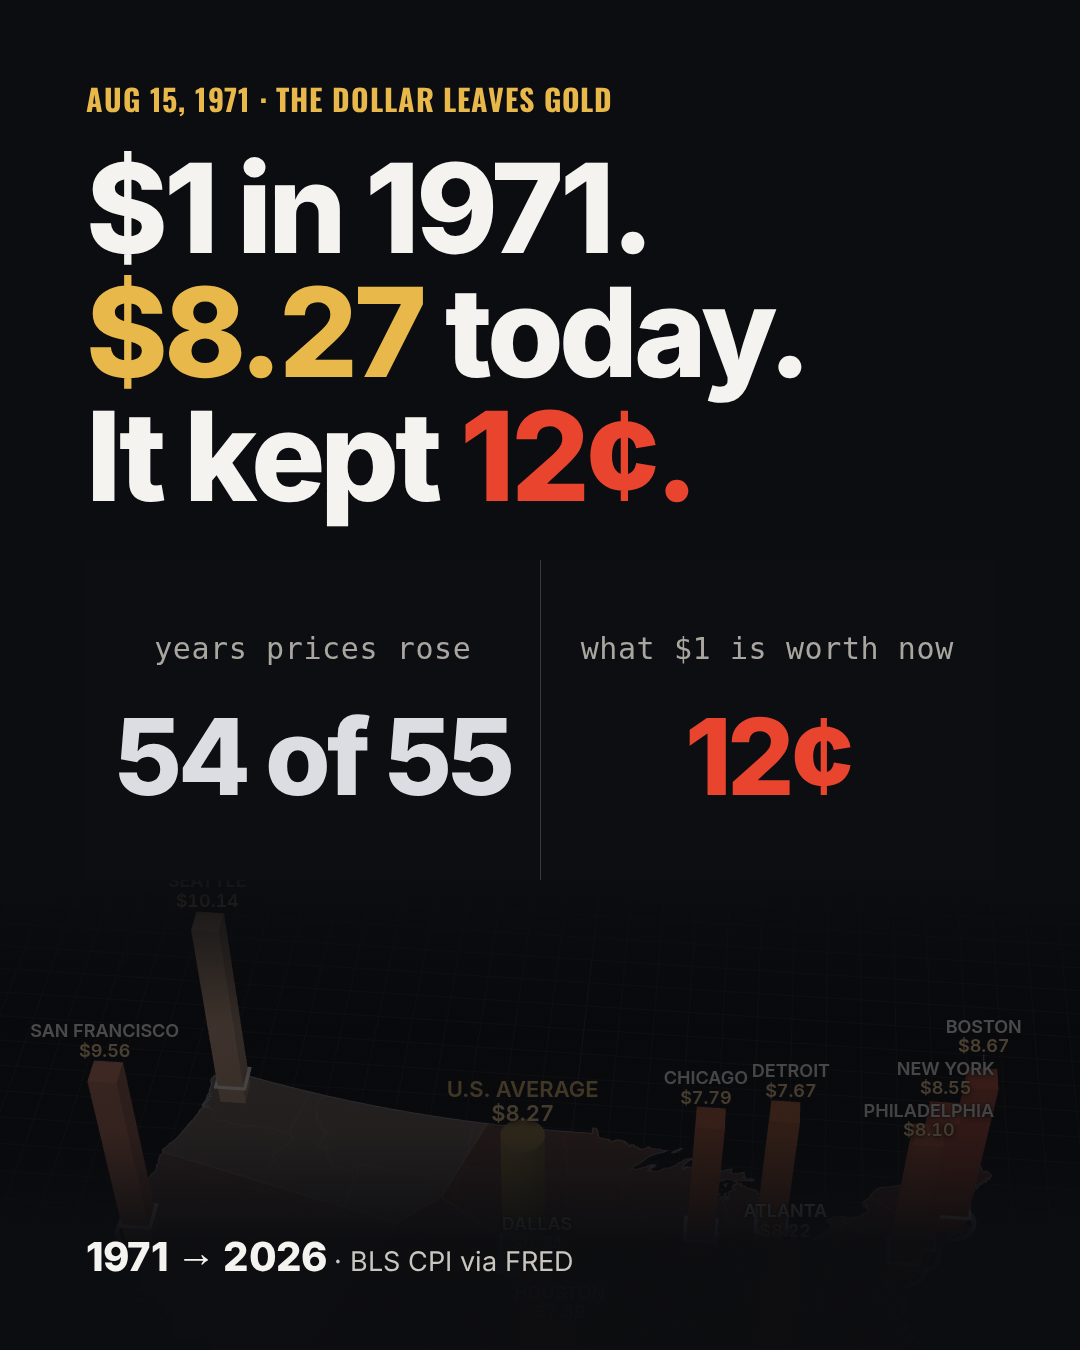
$1 in 1971. $8.27 today. It kept 12¢.
What happened on August 15, 1971
On a Sunday night in August 1971, Richard Nixon interrupted Bonanza to announce what he called a New Economic Policy. Three things at once: a 90-day freeze on wages and prices, a 10% surcharge on imports, and the one that outlived the other two. The United States would stop converting dollars into gold for foreign governments (Federal Reserve History, "Nixon Ends Convertibility of US Dollars to Gold and Announces Wage/Price Controls").
Some context, because the headline version skips it. Ordinary Americans had not been able to swap dollars for gold since 1933. What was left was the Bretton Woods deal from 1944: other countries pegged their currencies to the dollar, and the dollar was pegged to gold at $35 an ounce, redeemable by foreign central banks. By 1971 there were far more dollars overseas than gold in Fort Knox to back them, and other countries had started asking for the gold. Nixon closed the window.
He called it temporary. It never reopened. By 1973 the major currencies were floating against each other, and the dollar has been a pure fiat currency ever since. Its value is whatever the Fed, Congress, oil, wars, supply chains and the rest of us make it.
So I asked the obvious question. What has that dollar been worth since?
Your 1971 dollar, 55 years in 27 seconds
How the number is built
Everything comes from the Consumer Price Index for All Urban Consumers, the CPI-U, which the Bureau of Labor Statistics publishes every month and FRED, the St. Louis Fed's database, republishes.
- National: CPI-U, U.S. city average, all items, CPIAUCNS (not seasonally adjusted, 1982 to 1984 = 100). I use the annual average for each year from 1971 to 2025, and the latest month, August 2026, for 2026. Its seasonally adjusted twin is CPIAUCSL.
- Metros: the BLS all-items CPI-U for ten metro areas, the same ids on FRED: New York (CUURS12ASA0), Philadelphia (CUURS12BSA0), Boston (CUURS11ASA0), Chicago (CUURS23ASA0), Detroit (CUURS23BSA0), Dallas (CUURS37ASA0), Houston (CUURS37BSA0), Atlanta (CUURS35CSA0), San Francisco (CUURS49BSA0) and Seattle (CUURS49DSA0). Most metros are only priced every other month, so I take the first reading of each year, and the latest reading for 2026.
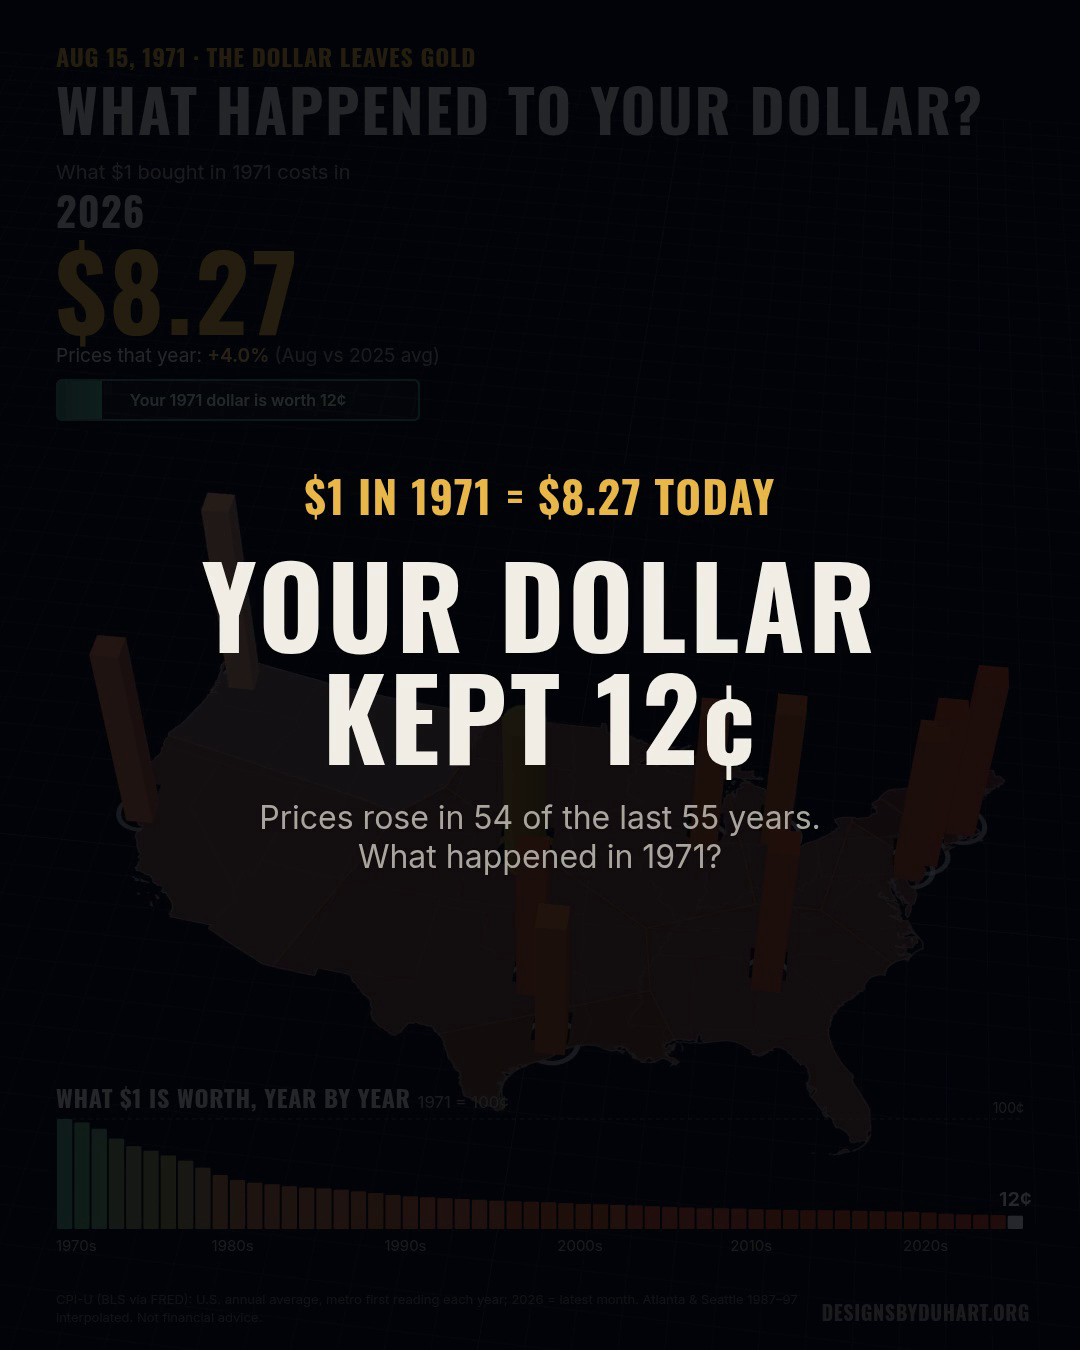
- The math: divide each year's index by its 1971 value. The 1971 index was 40.5. August 2026 is 334.98. That ratio, 8.27, is what $1 of 1971 costs now. Flip it and you get what the 1971 dollar is still worth: 40.5 / 334.98, about 12 cents.
Two footnotes I'd rather show than hide. BLS does not have Atlanta or Seattle readings for most of 1987 to 1997, so those years are interpolated in the map. And BLS collected no October 2025 prices during the lapse in appropriations last fall, so the 2025 average is built from 11 months. Neither changes the endpoint.
Play it yourself
55 years in one number
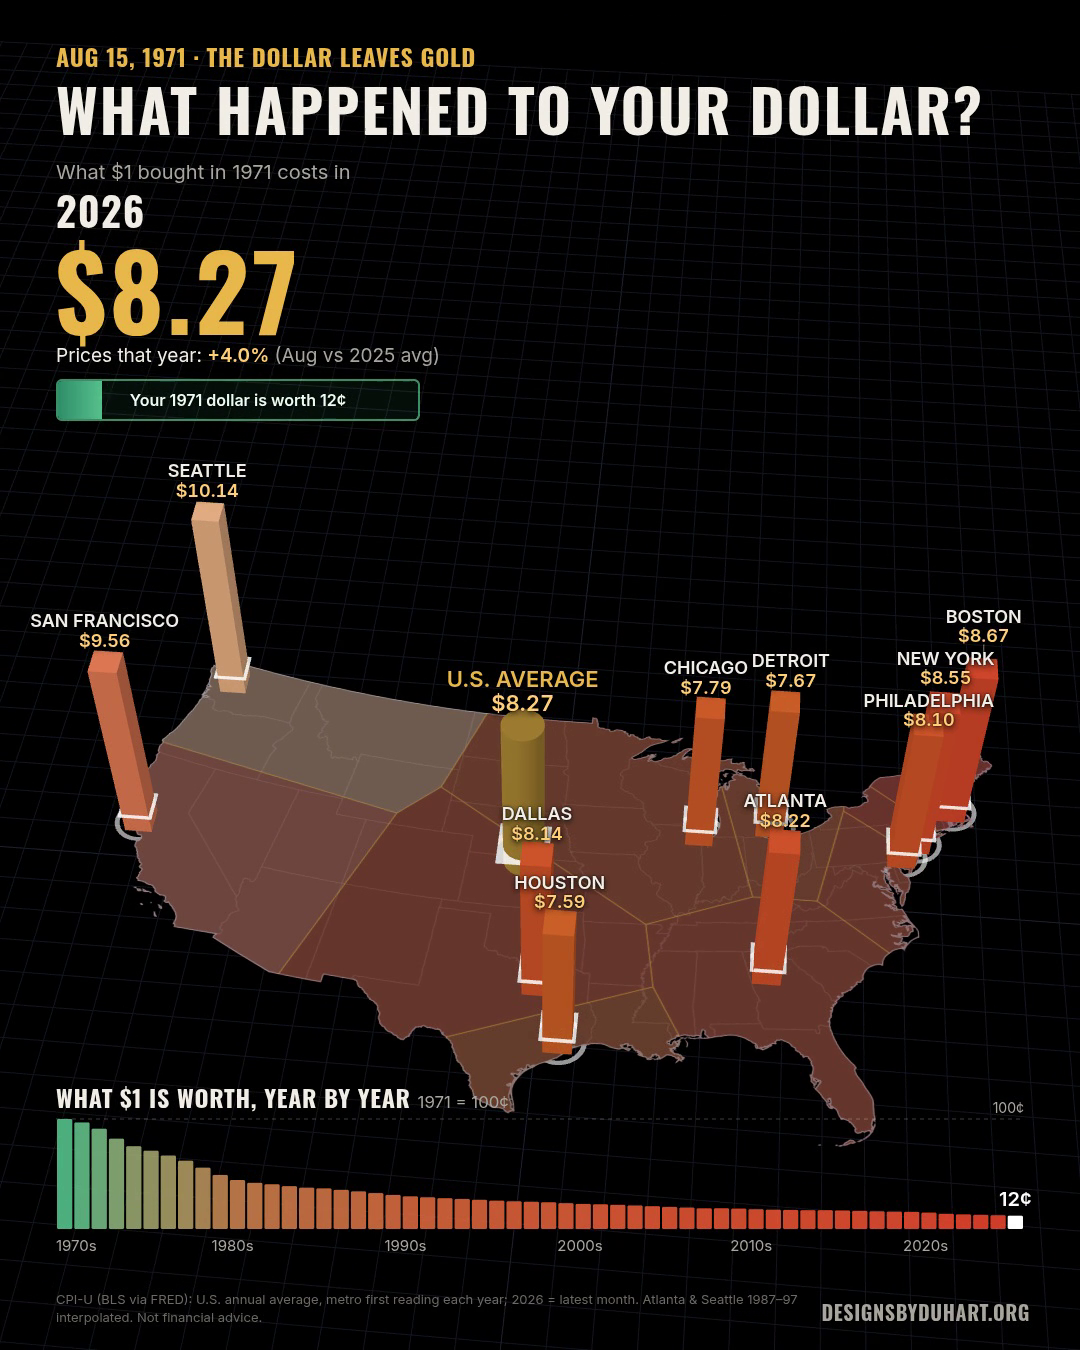
$1 in 1971 is $8.27 today. Said the other way, your 1971 dollar kept 12 cents.
It did not happen in one shot. Here is the walk, from the same data:
- 1974: $1.22. The oil embargo pushed prices up 11.0% in a single year.
- 1980: $2.03. Prices rose 13.5% that year, the peak of the whole series. The dollar had lost half its value in nine years.
- 1998: $4.02.
- 2011: $5.55.
- 2022: $7.23, after an 8.0% year. June 2022 alone was up 9.1% on June 2021, the biggest 12-month jump since 1981.
- 2026: $8.27, through August.
The pace changed a lot. The 1970s did the most damage per year. The 2010s were quiet, often under 2%. Then 2021 to 2023 packed about a decade of the quiet years into three. But the direction never really changed, which is the next point.
Prices rose in 54 of the last 55 years
Count the year-over-year changes from 1972 to 2026. That's 55 of them. Prices went up in 54.
The one exception is 2009. The CPI-U annual average fell 0.4%, from 215.3 in 2008 to 214.5. It took the worst financial crisis since the Depression to do it: a recession, a collapse in demand, and oil falling from about $145 a barrel in July 2008 to under $40 by that December. Prices were back above their 2008 level in 2010.
That tells you how the system is designed. The Fed doesn't aim for zero. Since 2012 its stated target has been 2% a year (Federal Reserve, Statement on Longer-Run Goals), on the theory that a little steady inflation is safer than any deflation. At exactly 2%, prices double about every 35 years. Steady erosion of cash is not a bug in that design. It's the plan.
The city spread
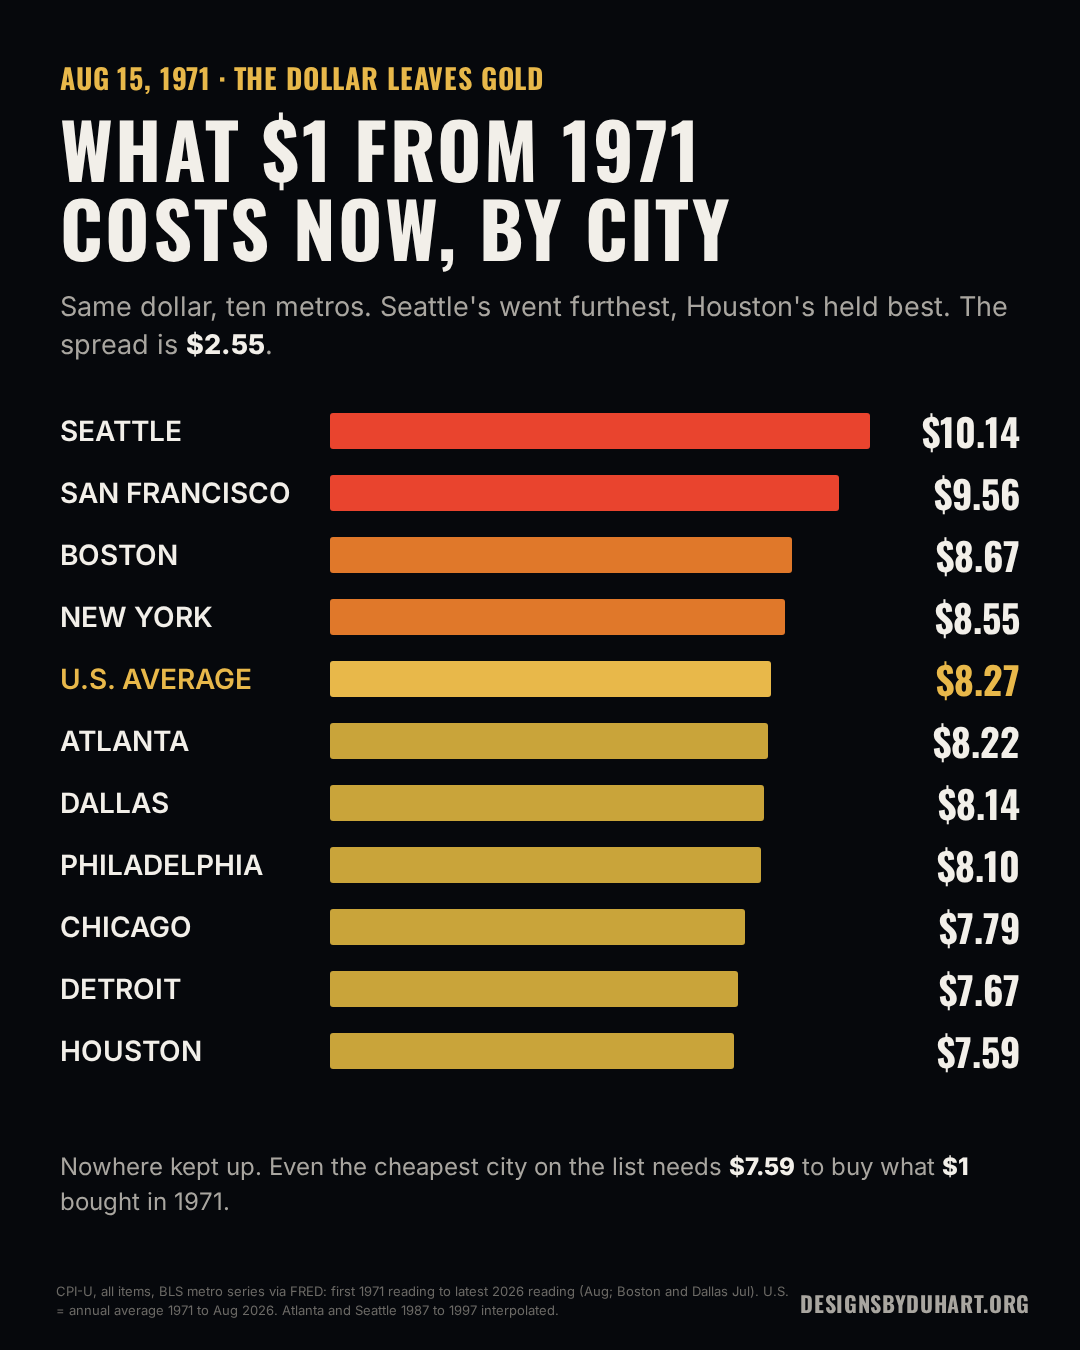
Same dollar, same 55 years, different cities. What $1 from 1971 costs now in each metro on the map:
- Seattle: $10.14
- San Francisco: $9.56
- Boston: $8.67
- New York: $8.55
- U.S. average: $8.27
- Atlanta: $8.22
- Dallas: $8.14
- Philadelphia: $8.10
- Chicago: $7.79
- Detroit: $7.67
- Houston: $7.59
That's a $2.55 spread between the top and the bottom. The coastal tech metros ran hottest. My guess is that most of that gap is housing, the biggest single piece of the CPI: Houston had room to build and Detroit lost people, and that's probably a big part of why they sit at the bottom.
One caution BLS itself gives. A metro index measures how prices changed inside that metro. It does not say Houston is cheaper than Seattle today, only that Houston's prices climbed less from where they started. And there's no city on the list where $1 still covers what it did in 1971. The best case is $7.59.
What $1 from 1971 costs now, by city
Why it matters to a paycheck
Prices going up 8x only hurts if pay doesn't. So I checked pay the same way.
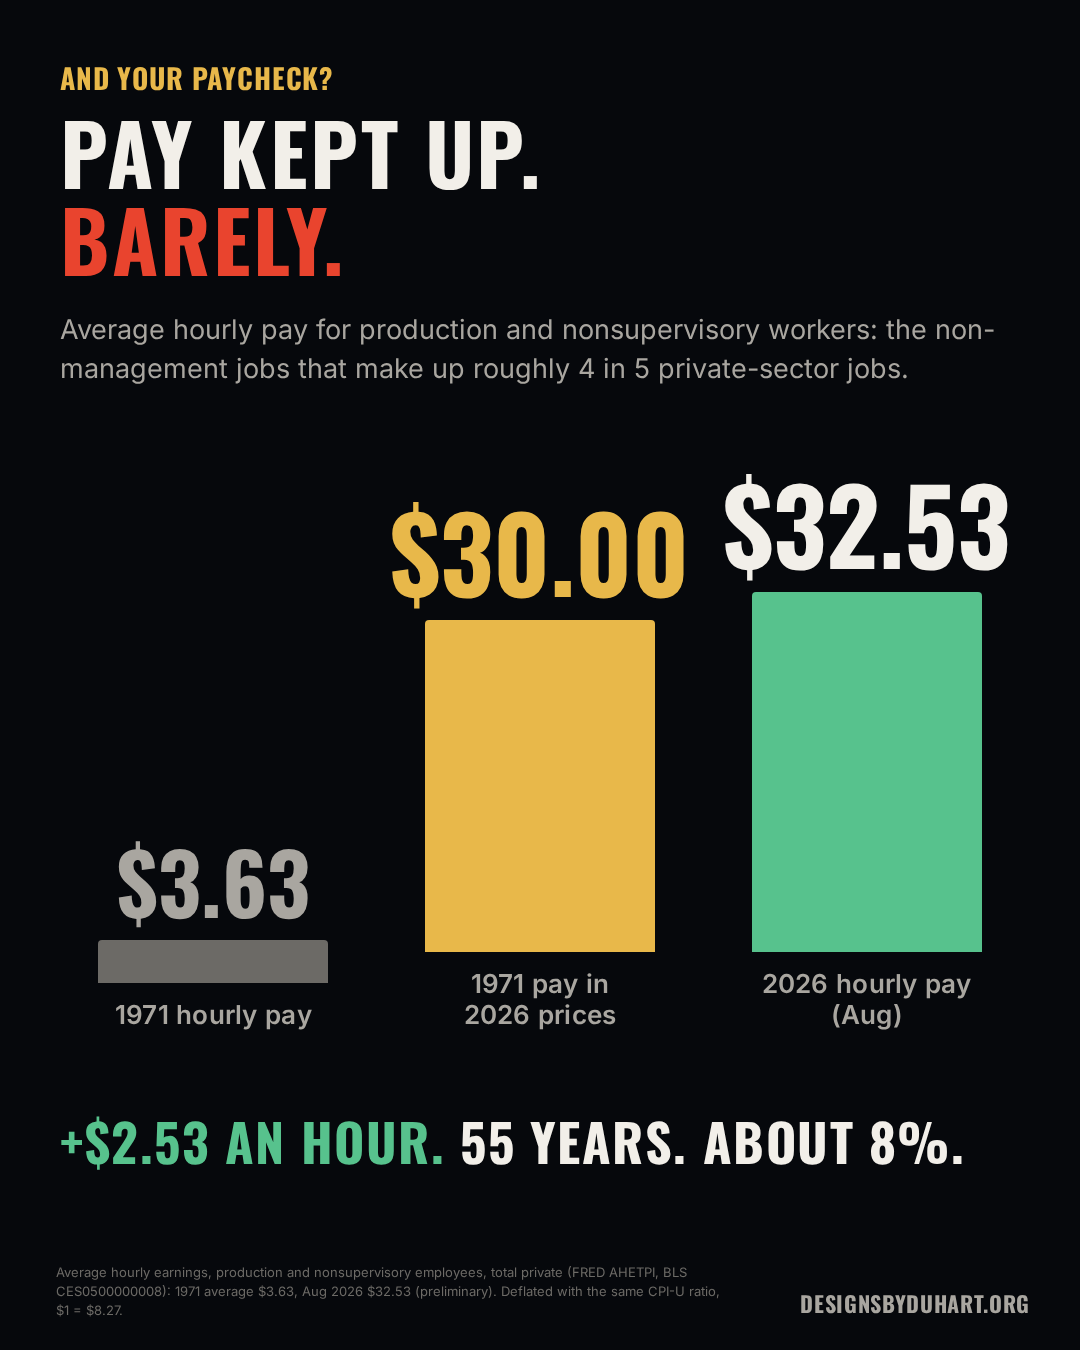
The longest clean wage series is average hourly earnings of production and nonsupervisory employees, AHETPI (BLS series CES0500000008). That's the non-management side of the private sector, roughly 4 in 5 jobs, and it goes back to 1964.
- 1971: $3.63 an hour, the average of that year.
- 1971 pay in 2026 prices: $3.63 x 8.27 = $30.00.
- August 2026: $32.53 an hour (preliminary).
So the typical non-management hour pays about $2.53 more than it did in 1971, after inflation. About 8% in 55 years, or roughly 0.15% a year. Pay mostly kept up with prices. It didn't get much past them.
Over the same stretch, the economy got a lot more productive per hour worked, and that gain mostly didn't land in this paycheck. That's the same gap I charted in Trickle-down didn't trickle, so I won't repeat it here.
The practical part is simpler. Cash that sits still loses value. At the current pace, 3.4% from August 2025 to August 2026, $10,000 in a checking account buys about $9,670 worth of stuff a year later. Whatever doesn't keep up with that is going backwards quietly.
Pay kept up. Barely.
What the data cannot say
I like this chart a lot, which is exactly why I want to be honest about where it stops.
- 1971 is a starting point, not a proven cause. Inflation was already rising before Nixon closed the gold window, driven by Vietnam and Great Society spending. The worst of the 1970s came from two oil shocks (1973 and 1979) and a Fed that was slow to fight it. Ending gold convertibility removed a constraint. It didn't print the money by itself. People argue about how much 1971 explains, and I don't think a CPI chart settles that.
- The CPI is a basket, not your basket. CPI-U covers urban consumers, about 93% of the population, and weights spending the way the average urban household spends. If you rent in Seattle and drive a lot, your number is different from someone who owns a paid-off house in Houston.
- Substitution. When beef gets expensive people buy chicken. The headline CPI-U only partly captures that. BLS publishes a chained CPI that captures more of it, and it runs a little lower. Starting in the late 1990s BLS also changed its methods after the Boskin Commission estimated the CPI was overstating inflation by about 1.1 points a year.
- Quality adjustment. A 2026 TV or car isn't the 1971 version. BLS adjusts some prices for quality. That's reasonable, and it's also a judgment call that people fairly argue about.
- Housing is rent, not home prices. For homeowners the CPI uses owners' equivalent rent, what your house would rent for. It doesn't track the price of buying a house, and it doesn't track stocks or any other asset. If home prices are your problem, the CPI understates it.
- Metros are first readings, the nation is an average. The metro bars start from the first 1971 reading and the national line from the 1971 annual average, so they're close but not the same yardstick.
- Seasonal adjustment moves the second decimal. On the seasonally adjusted series, CPIAUCSL, August 2026 over the 1971 average comes to $8.25 instead of $8.27. It's still 12 cents.
Your dollar kept 12 cents
So, what happened in 1971?
The dollar stopped being tied to anything you could hold, and for 55 years it has bought a little less nearly every year. That's not a conspiracy. It's the system working the way it was built, with a 2% target and a promise that steady, mild inflation beats the alternative. You can agree with that trade and still notice who pays for it: anyone holding cash, and anyone whose raise came in under the line.
This is episode 1 of NetflixRefactor, the Filler Seasons. Episode 2 is Monday: The AI Bubble. If money that sits still shrinks, it has to go somewhere, and for the last three years a lot of it has gone into one trade.
So here's my question for you. Where are you keeping the dollars you don't want to shrink?
Sources
- Federal Reserve History, Nixon Ends Convertibility of US Dollars to Gold and Announces Wage/Price Controls
- FRED, CPI-U, U.S. city average, not seasonally adjusted, CPIAUCNS and seasonally adjusted, CPIAUCSL
- FRED metro CPI-U, all items: New York, Philadelphia, Boston, Chicago, Detroit, Dallas, Houston, Atlanta, San Francisco, Seattle
- FRED, Average hourly earnings of production and nonsupervisory employees, total private, AHETPI
- Bureau of Labor Statistics, Consumer Price Index and CPI frequently asked questions
- Federal Reserve, Statement on Longer-Run Goals and Monetary Policy Strategy
- Social Security Administration history archive, the Boskin Commission report (1996)
Not financial advice. The map, the animation and the numbers are mine; the data is public, so check me.
Next, Monday: The AI Bubble. If money that sits still shrinks, it has to go somewhere, and for three years a lot of it has gone into one trade.
More: LinkedIn · Instagram. Portfolio and case studies: designsbyduhart.org.
If any of this saved you an afternoon, Buy me a coffee.