Trading Places: who owes America's debt now?
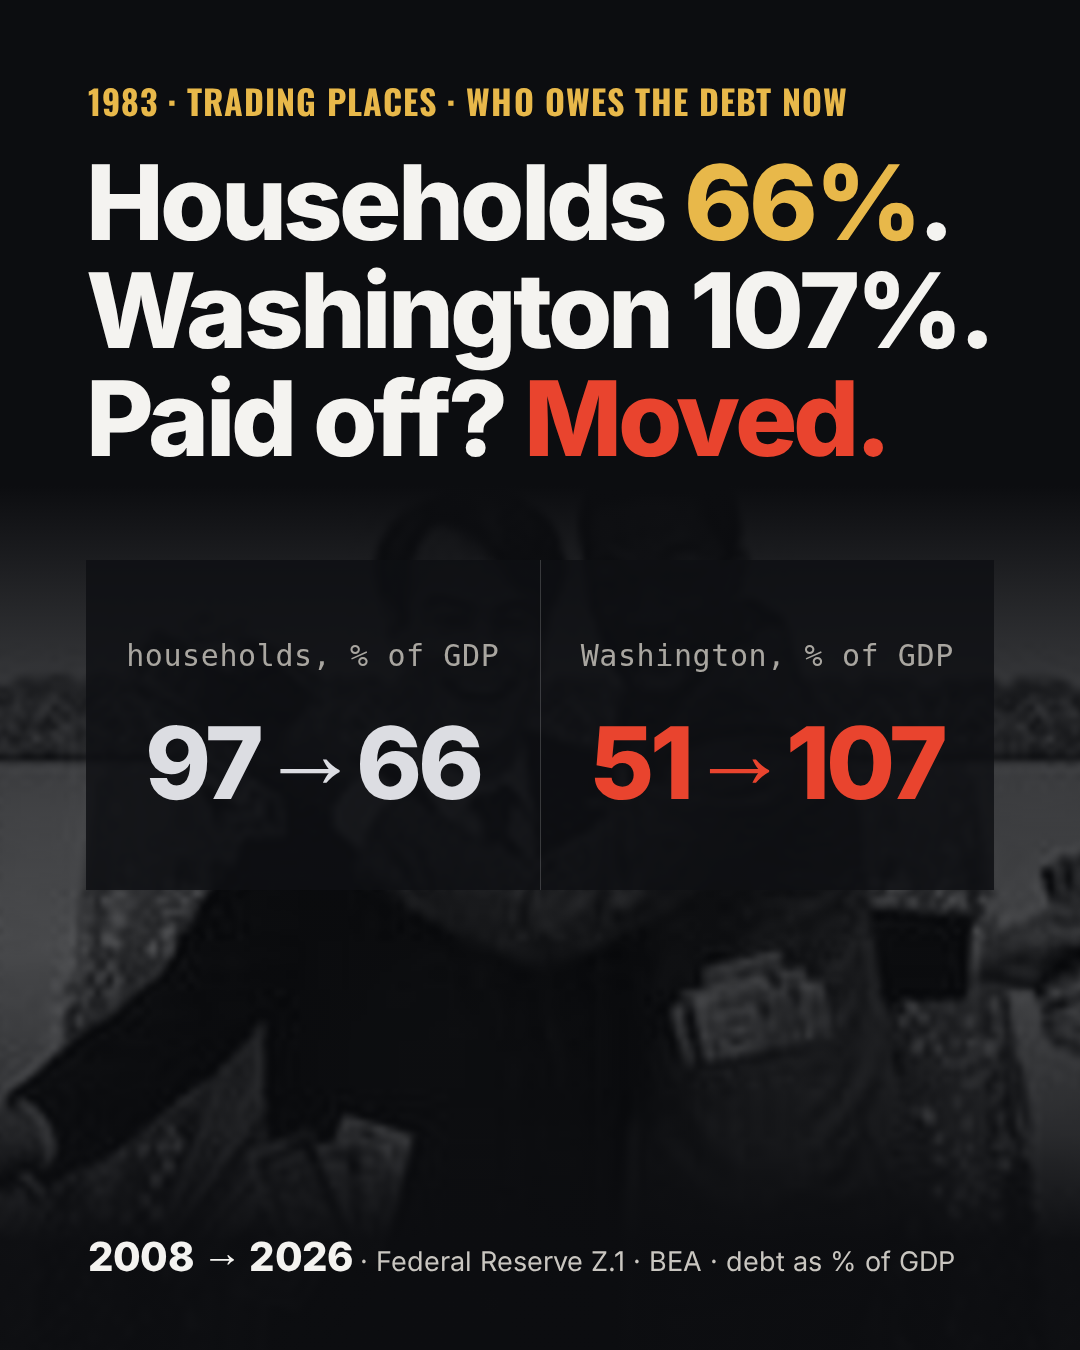
Households 66%. Washington 107%. Paid off? Moved.
Trading places
Episode 2 ended on four words: not 2000 yet, watch the debt. So this week I watched it.
The question sounds simple. Who owes America's debt, and who is it owed to? I expected a story about everyone borrowing more. That's not what the data says. The total, measured against the size of the economy, has barely moved since the 2008 crash. What moved is who's holding the bag.
There's a movie for that. In Trading Places (1983), two rich brothers bet a dollar that they can swap a commodities broker and a street hustler and the two men will turn into each other. Dan Aykroyd loses everything, Eddie Murphy gets the office, and nobody asked either of them. That's roughly what happened to American households and Washington after 2008. Somebody swapped them.
Same method as episode 1. Pick the start dates, pull the numbers from the people who publish them, plot them. The main source is the Federal Reserve's Financial Accounts of the United States, the Z.1 release, which counts every dollar of debt by who owes it. The latest one came out September 11, 2026, with data through June. GDP comes from the Bureau of Economic Analysis.
Who owes America's debt, 1980 to 2026
What the chart shows
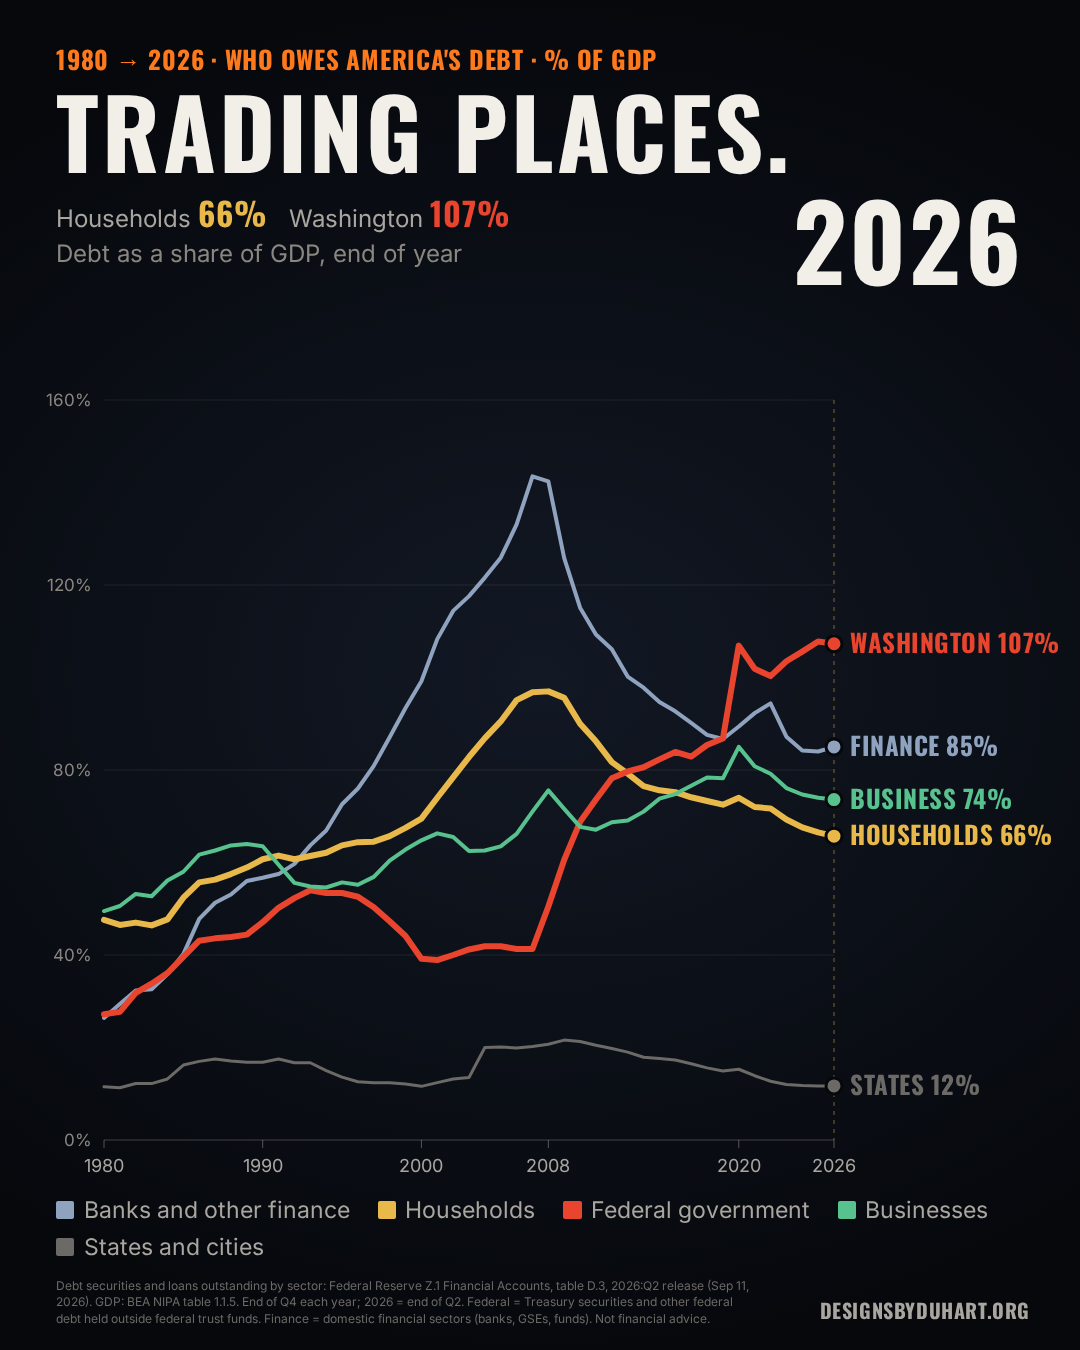
Five lines, one for each part of the economy that borrows. Every one is debt securities and loans as a share of GDP, so a line going up means that group owes more relative to everything the country produces in a year.
- 1980. Households owed 48% of GDP. Washington owed 27%. That's the starting line for this season, the year before Reagan took office.
- 2008. Households peaked at 97%, almost a full year of national output, most of it mortgages. Banks and other financial firms owed 142% on their own books. Washington owed 51%.
- 2013. Washington passed households, and the lines never crossed back.
- 2020. The pandemic added 20 points of GDP to federal debt in a single year, 87% to 107%.
- Mid 2026. Households are down to 66%, back where they were in the late 1990s. Washington is at 107%.
In dollars, federal debt went from $7.4 trillion at the end of 2008 to $34.9 trillion in June 2026. Household debt went from $14.2 trillion to $21.4 trillion over the same stretch, while the economy itself grew 2.2 times. Households grew their debt slower than the economy. Washington grew its debt more than twice as fast as the economy.
Trading places, year by year
The total barely moved
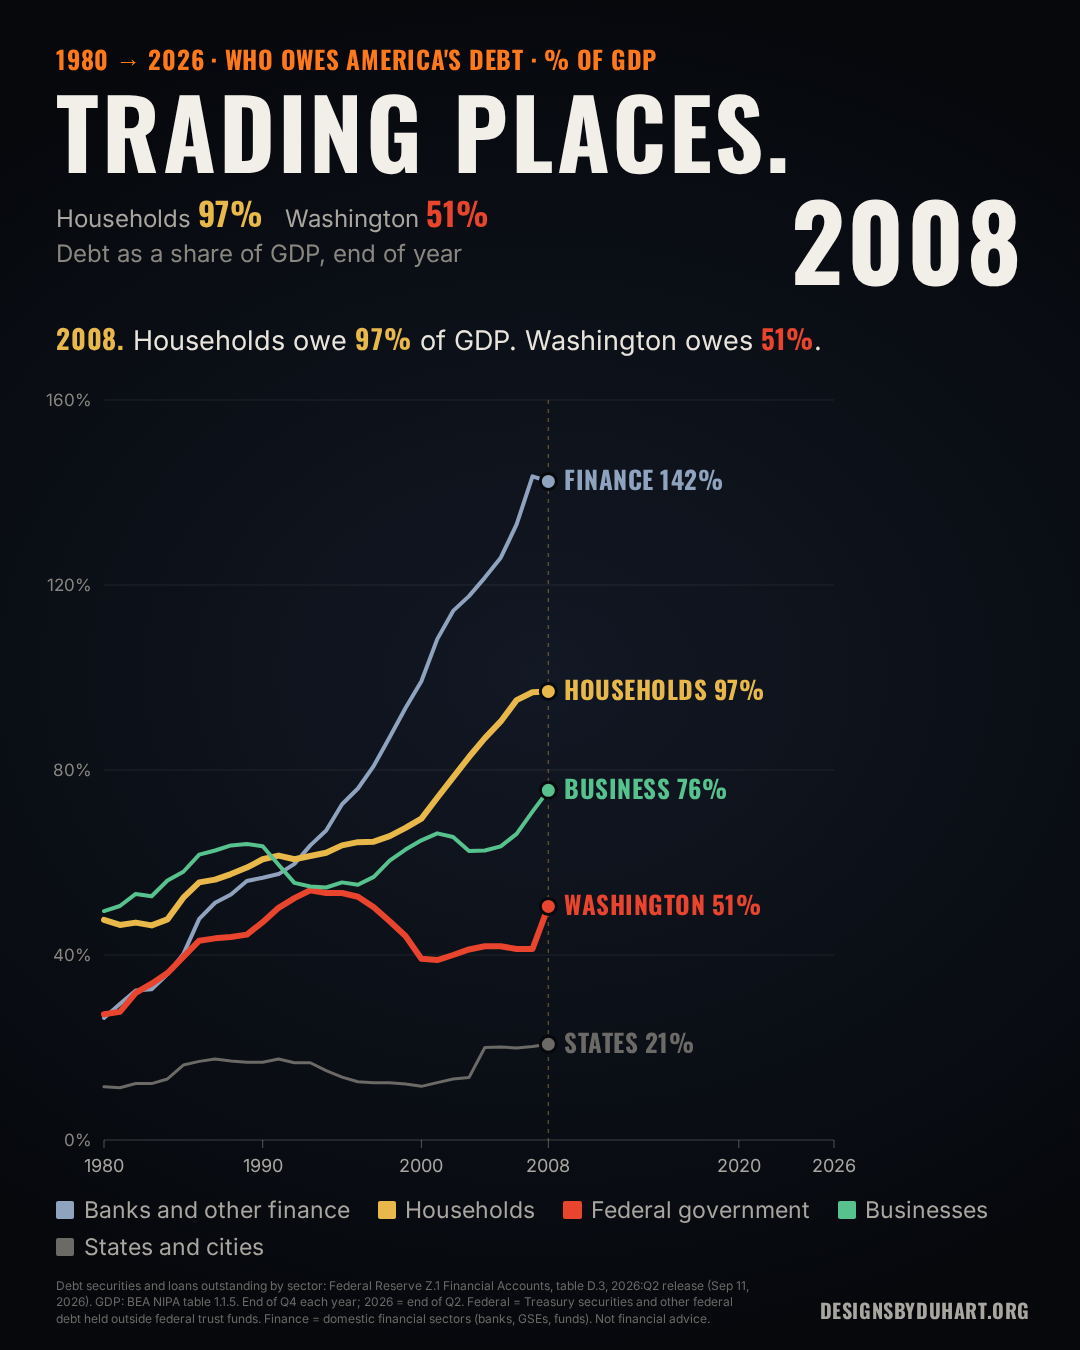
This is the part that surprised me. Add up everyone outside the financial sector, meaning households, businesses, states and cities, and Washington, and you get 244% of GDP at the end of 2008 and 258% in the middle of 2026. The Fed's own summary puts the ratio at 2.59 and calls it slightly above its pre-pandemic average.
So the country didn't really pay its debt down after 2008. It moved it.
- Households: down 31 points.
- States and cities: down 9.
- Businesses: down 2.
- Washington: up 57.
The banks did their own version. Debt owed by financial firms fell from 142% of GDP to 85%, which is the deleveraging everyone talked about after the crash. That debt isn't part of the 258%, because it's mostly the banking system borrowing to lend, but it tells the same story. The private side got lighter. The public side got heavier.
Where the debt went
The bill
Moving debt onto Washington's books has a price, and it shows up as interest. For about a decade it was cheap. Rates sat near zero, and in 2015 federal interest was only 2.4% of GDP even though the debt kept climbing. Then rates went up in 2022 and the bill caught up with the balance.
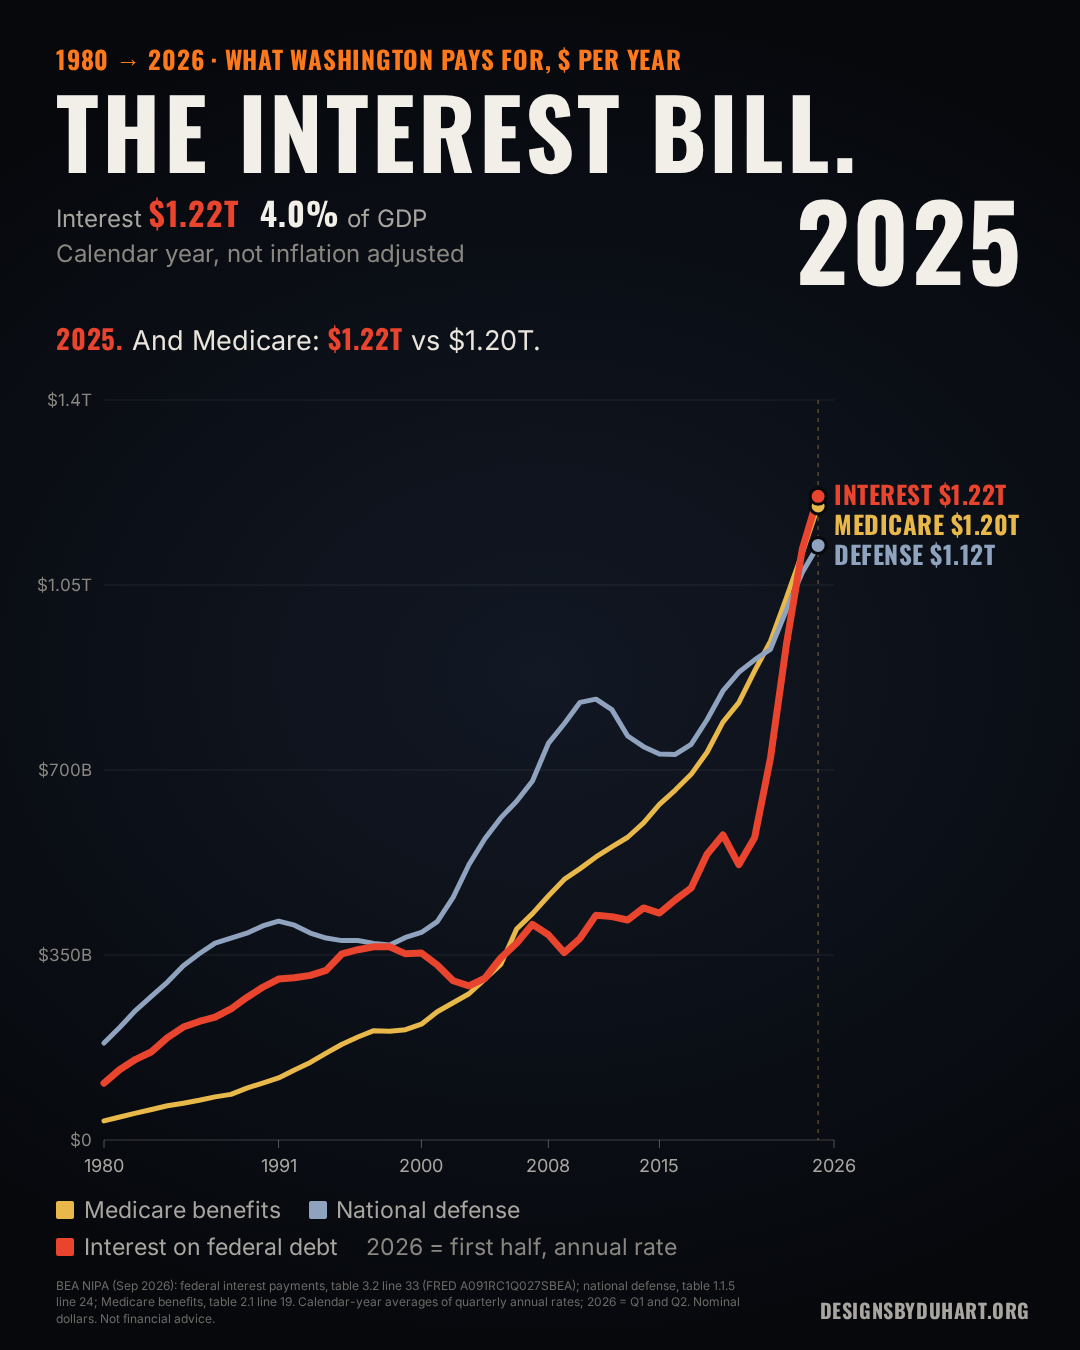
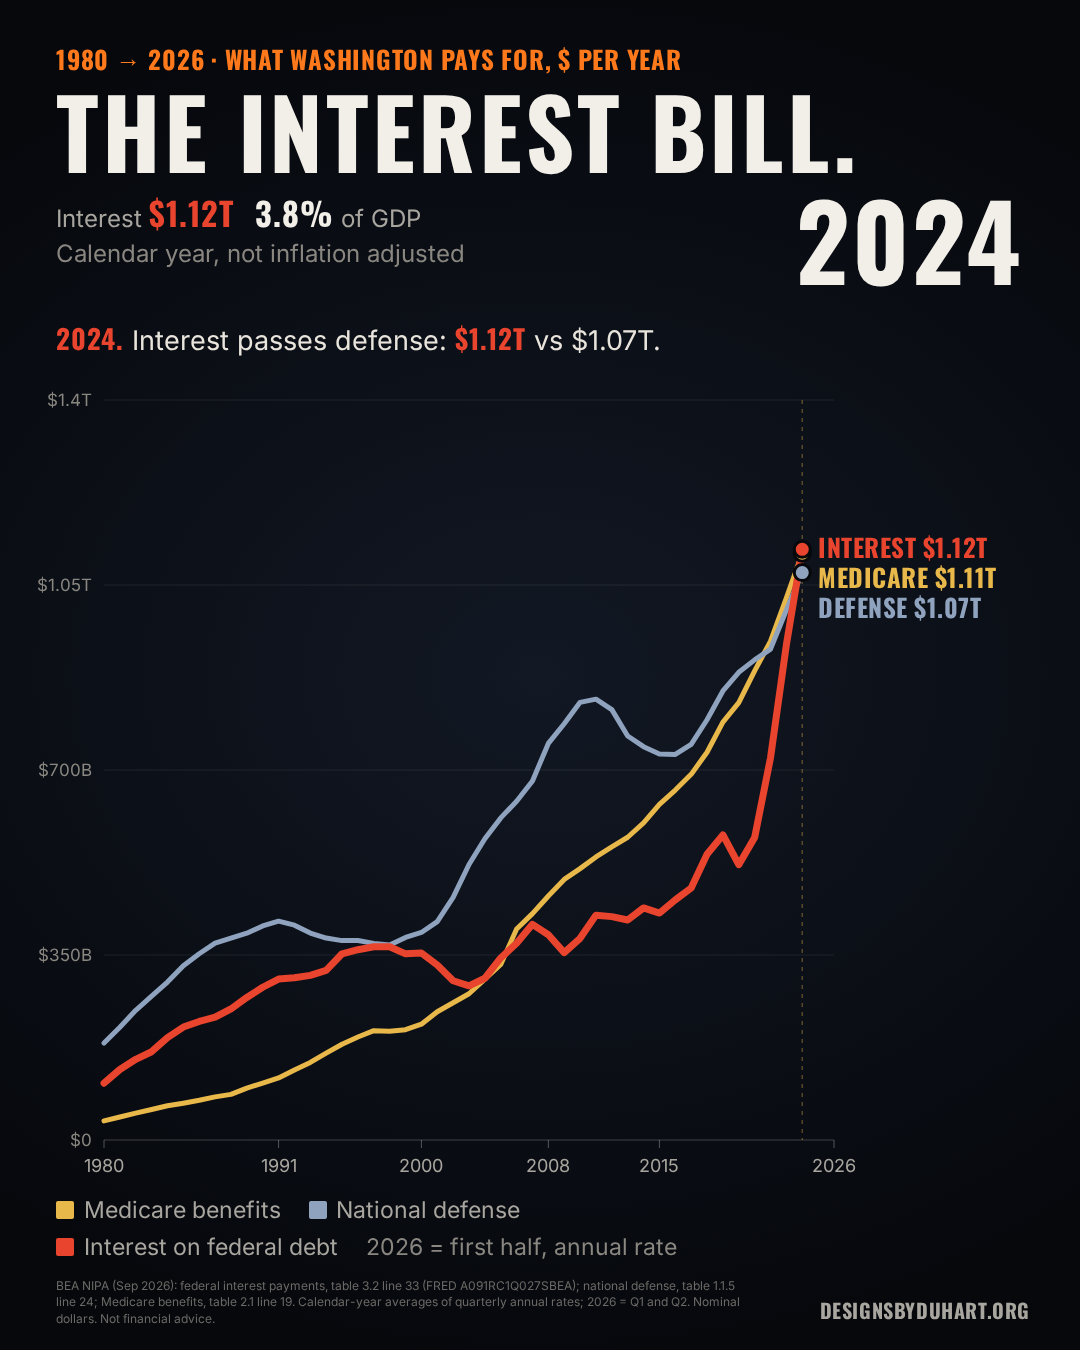
The cleanest long series is from the BEA's national accounts: federal interest payments, the same series FRED calls A091RC1Q027SBEA. I lined it up with national defense and with Medicare benefits, two things nobody in Washington would call small.
- 2024: interest $1.12 trillion, defense $1.07 trillion. Interest passed defense.
- 2025: interest $1.22 trillion, Medicare $1.20 trillion, defense $1.12 trillion. Interest passed Medicare too.
- As a share of the economy, interest was 3.95% of GDP in 2025, the highest since 1998.
Treasury's own budget numbers agree on the direction, with their own definitions. In fiscal 2024 net interest was $882 billion against $874 billion for defense. In fiscal 2026 through August, net interest is $1.02 trillion, Medicare $979 billion, defense $876 billion.
One more number from the same BEA table. About a quarter of federal interest, 25.6% in 2025, is paid to holders outside the United States.
The interest bill, 1980 to 2026
The interest bill, year by year
Who lends to Washington
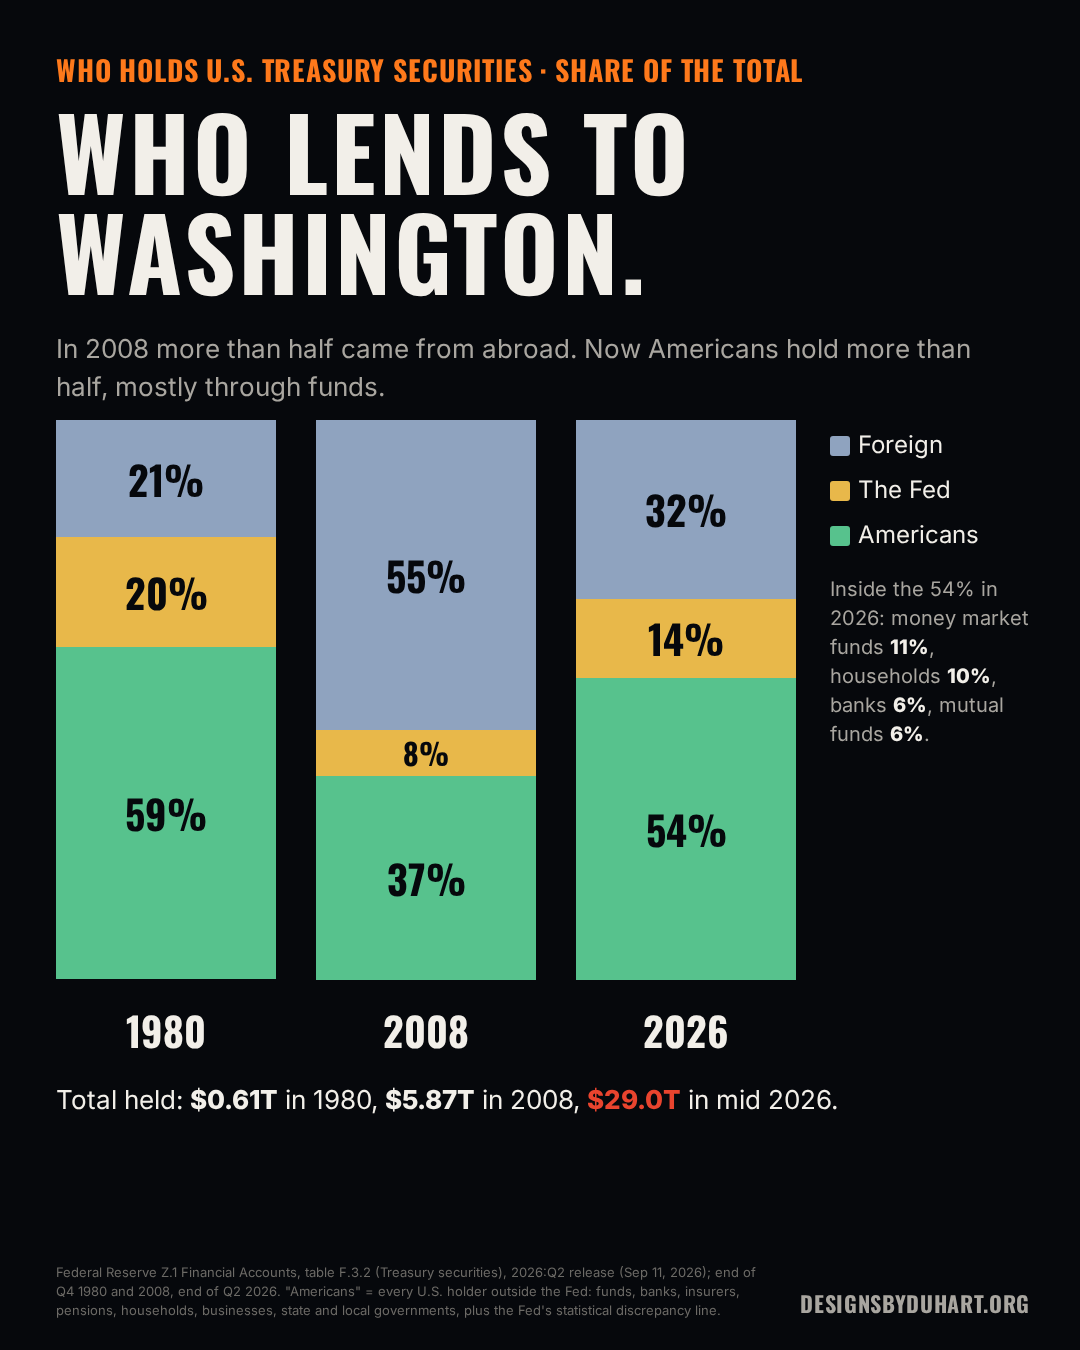
If Washington owes it, somebody holds it. Z.1 has a table for that too, Treasury securities by holder.
In 1980 there was $0.61 trillion of Treasuries out there, and Americans held 59% of it. By the end of 2008 the total was $5.87 trillion and 55% sat with foreign holders, central banks and private investors abroad. That was the era of the "China holds our debt" headlines.
That flipped as well. In June 2026 there's $29.0 trillion of Treasury securities, foreign holders have 32%, the Federal Reserve has 14% (it peaked at 26% at the end of 2021), and Americans hold 54%. The biggest pieces of that are money market funds at 11% and households directly at 10%. If you have cash in a money market fund, you're probably lending to Washington right now.
For scale, Treasury's Debt to the Penny shows $32.44 trillion of debt held by the public on October 6, 2026, out of $40.27 trillion in total. GDP runs at about $32.6 trillion a year. The debt the public holds is now about the size of the whole economy.
Who holds Treasury securities
Households paid down, mostly
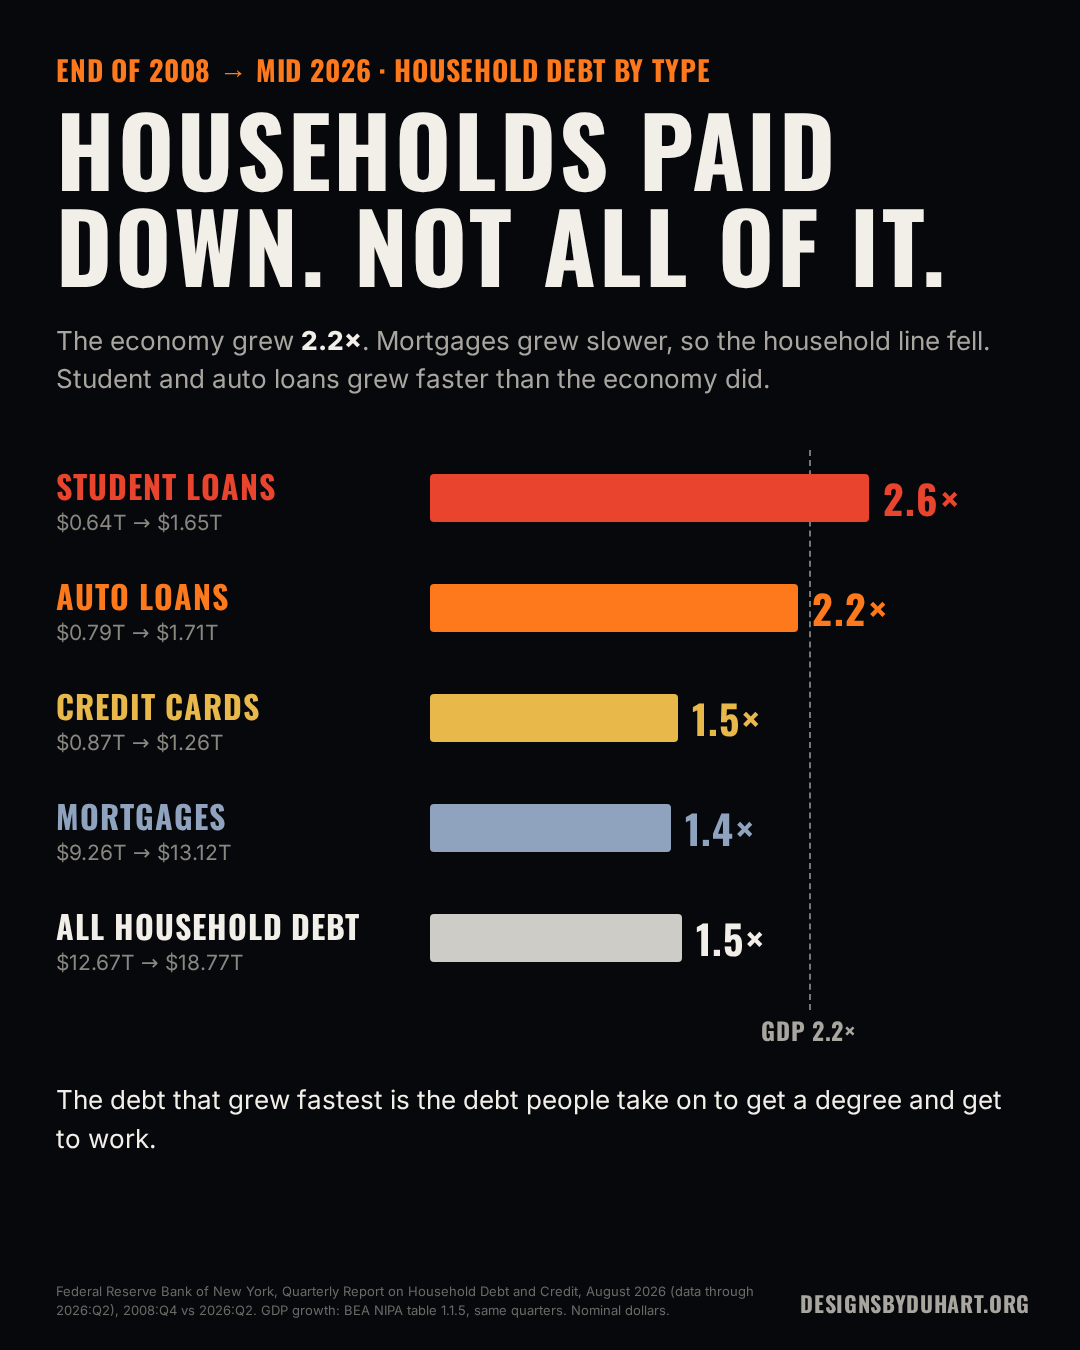
The household line fell, but not every kind of household debt did. The New York Fed's household debt report, from credit bureau data, breaks it out by type. From the end of 2008 to the middle of 2026, while the economy grew 2.2 times:
- Mortgages: $9.26 trillion to $13.12 trillion, 1.4 times.
- Credit cards: $0.87 trillion to $1.26 trillion, 1.5 times.
- Auto loans: $0.79 trillion to $1.71 trillion, 2.2 times.
- Student loans: $0.64 trillion to $1.65 trillion, 2.6 times.
So the household share fell because mortgages grew slower than the economy, and mortgages are about 70% of what households owe. Student loans went the other way. The debt that grew fastest is the debt people take on to get a degree and get to work, and that's worth sitting with before anyone calls households "deleveraged".
Household debt by type
Business, private credit and the AI money
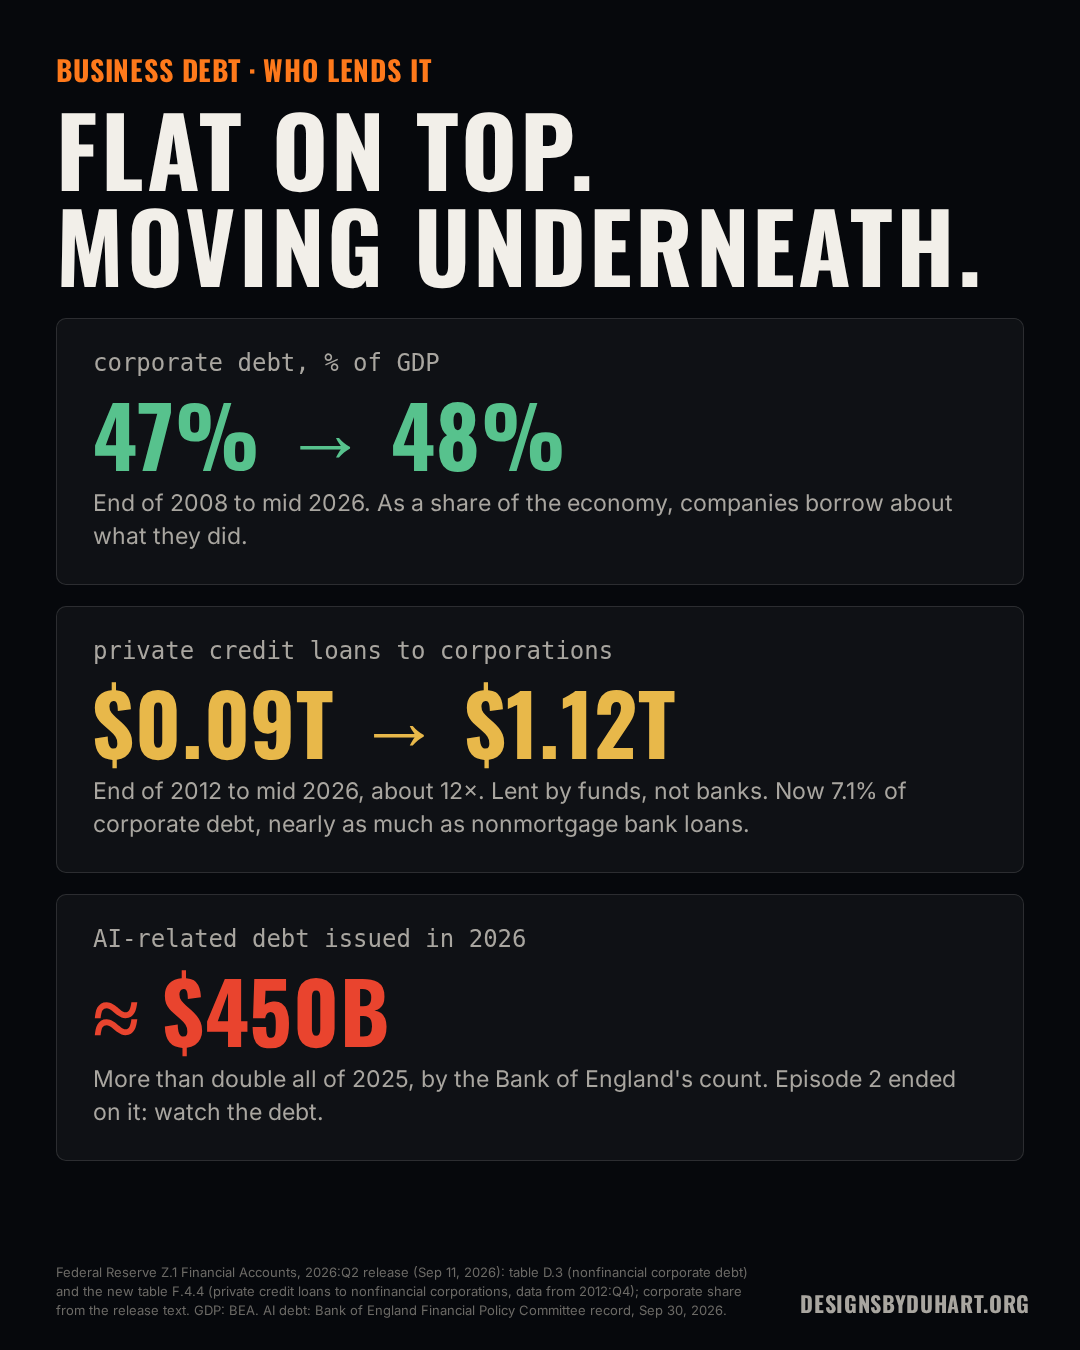
Businesses are the flat line in the middle of the chart. Corporate debt was 47% of GDP at the end of 2008 and 48% now. Nothing dramatic.
Underneath, though, who lends to them is changing. This Z.1 release added private credit for the first time, meaning loans made by funds instead of banks. Private credit loans to corporations went from $0.09 trillion at the end of 2012 to $1.12 trillion in June 2026, about 12 times. The Fed says they're now 7.1% of corporate debt, nearly as much as nonmortgage loans from banks.
That's where the AI buildout from episode 2 comes back in. The Bank of England counts about $450 billion of AI-related debt issued worldwide so far in 2026, more than double all of 2025. How much of that runs through private credit I can't tell from these tables. But lending that happens outside the banks is exactly where it would show up first. On a chart of business debt to GDP you can't see it yet. In two or three years you might.
The new lender
What the data cannot say
- It's a ratio. Debt to GDP moves when GDP moves. In 2020 the economy shrank for a quarter and every ratio jumped. I used year-end values to keep the lines readable, which hides some of that.
- Different counts of federal debt. Z.1 counts federal debt held outside the government's own trust funds: $34.9 trillion in June. Treasury's Debt to the Penny counts $32.4 trillion held by the public in October. They're built differently, so use each one for its own trend and don't mix them.
- Interest depends on the definition. The BEA series includes some imputed interest on federal employee pensions, so it runs higher than the budget's "net interest" line. The budget's Medicare line is net of the premiums people pay, so it runs lower. On both measures interest passed defense. On Medicare it depends on the measure and the period, and in the first half of 2026 the BEA numbers have Medicare slightly back in front, $1.29 trillion to $1.27 trillion at an annual rate.
- Holder data is partly at market value. When bond prices fall, some holders' shares shrink without anyone selling. Foreign holdings also run through custodians, so "foreign" says where the account is, not always who owns it.
- One odd step. The states and cities line jumps in 2004, from 13.5% to 20.0% of GDP in a year. That looks like a change in how it's measured more than a borrowing spree, but I left the published numbers alone.
- It doesn't say why. The chart shows the swap. It doesn't prove Washington bailed households out. Some of that federal debt is crisis spending, some is tax cuts, some is an aging population drawing on Medicare and Social Security. Those are separate arguments and this chart doesn't settle them.
- Private credit is new. The series starts in 2012 and the Fed just built it. Expect revisions.
So who carries it?
My read: it didn't go away. It moved.
After 2008, households and banks got their balance sheets back in order, and that was a good thing. It hurt, foreclosures and all, but it happened. The cost of doing it mostly landed on Washington, then the pandemic stacked more on top, and as long as rates were near zero nobody felt the weight. Now they're not near zero, and since 2021 interest has grown faster than defense or Medicare: 2.1 times, against 1.2 and 1.4.
Here's the part I keep coming back to. Federal debt is still household debt, one step removed. We pay it through taxes, through inflation like the kind in episode 1, or through cuts to something else. And a lot of us are also the lenders, through money market funds and retirement accounts. We owe it, and in part we're owed it.
So I'll ask it the way the movie does. The debt traded places. Who should carry it now, and what would you give up to make the interest bill smaller?
Next week, episode 4: Futures Outlook. Continuing resolutions, what they mean for your Roth, and why Social Security's trust fund date matters. In Trading Places the whole thing ends in the futures pit. So does this season.
Sources
Debt by sector, Treasury holders, private credit: Federal Reserve Board, Financial Accounts of the United States, Z.1, 2026:Q2 release, Sep 11, 2026: table D.3 (debt outstanding by sector: households LA154104005, nonfinancial business LA144104005, nonfinancial corporate LA104104005, federal LA314104005, state and local LA214104005, domestic financial LA794104005), table F.3.2 (Treasury securities by holder), table F.4.4 (private credit loans). Release text on private credit and the 2.59 debt to GDP ratio: Z.1 PDF.
GDP, interest, defense, Medicare: Bureau of Economic Analysis, National Income and Product Accounts, via the NIPA data files: GDP (table 1.1.5 line 1), federal interest payments (table 3.2 line 33, also FRED A091RC1Q027SBEA), interest to the rest of the world (table 3.2 line 35), national defense consumption expenditures and gross investment (table 1.1.5 line 24), Medicare benefits (table 2.1 line 19). Calendar-year averages of quarterly annual rates; 2026 is Q1 and Q2.
Budget outlays: U.S. Treasury, Monthly Treasury Statement, table 9, fiscal years 2024 and 2025 and fiscal 2026 through August 31.
Total federal debt: U.S. Treasury, Debt to the Penny, Oct 6, 2026.
Household debt by type: Federal Reserve Bank of New York, Quarterly Report on Household Debt and Credit, August 2026 (data through 2026:Q2).
AI-related debt: Bank of England, Financial Policy Committee record, Sep 2026.
Earlier episodes: Episode 1, Honey, I Shrunk the Dollar · Episode 2, The Big Short: bubble or base camp?
Not financial advice. I build data pipelines; I do not manage money.
Next, episode 4: Futures Outlook. Continuing resolutions, your Roth and Social Security. Trading Places ends in the futures pit, and so does this season.
More: LinkedIn · Instagram. Portfolio and case studies: designsbyduhart.org.
If any of this saved you an afternoon, Buy me a coffee.